Operations | Monitoring | ITSM | DevOps | Cloud

Latest News

SAI Something Linux: Monitoring Linux with Splunk App for Infrastructure

Metrics and logs go together like cookies and milk. Metrics tell you when you have a problem, and logs/events often tell you why that problem happened. But it’s always been harder than it needed to be to get both types of data onto a single screen, especially when the sysadmins using the tools aren’t necessarily daily experts in managing those monitoring platforms.

Top Seven E-commerce Platforms in 2020

The introduction of e-commerce stores has made life so easy for the people. It does not make a difference if you are the consumer or a seller. For a seller, it provides the opportunity to express the worth of their brand and product(s). For a consumer, it gives them an all in one platform, where they can shop for multiple categories. With this, the most significant ease for both parties is to opt for e-commerce business is that you can do all this without taking a step out of their house.

BIRCH for Anomaly Detection with InfluxDB

In this tutorial, we’ll use the BIRCH (balanced iterative reducing and clustering using hierarchies) algorithm from scikit-learn with the ADTK (Anomaly Detection Tool Kit) package to detect anomalous CPU behavior. We’ll use the InfluxDB 2.0 Python Client to query our data in InfluxDB 2.0 and return it as a Pandas DataFrame. This tutorial assumes that you have InfluxDB and Telegraf installed and configured on your local machine to gather CPU stats.

Diagnosing out-of-memory errors on Linux

Out-of-memory (OOM) errors take place when the Linux kernel can’t provide enough memory to run all of its user-space processes, causing at least one process to exit without warning. Without a comprehensive monitoring solution, OOM errors can be tricky to diagnose. In this post, you will learn how to use Datadog to diagnose OOM errors on Linux systems.

Embed Your Status Page Everywhere

A well-crafted status page is designed to save you time, energy, and resources when communicating service irregularities. Instead of fielding thousands of support requests when you experience an outage, a status page provides a self-service way for your customers to get up-to-the minute information about any current downtime. It also allows you to proactively communicate maintenance and other work in advance.

Where did all my spans go? A guide to diagnosing dropped spans in Jaeger distributed tracing

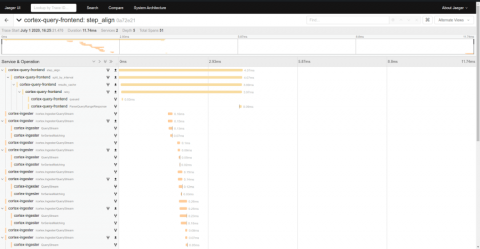
Nothing is more frustrating than feeling like you’ve finally found the perfect trace only to see that you’re missing critical spans. In fact, a common question for new users and operators of Jaeger, the popular distributed tracing system, is: “Where did all my spans go?” In this post we’ll discuss how to diagnose and correct lost spans in each element of the Jaeger span ingestion pipeline.

Monitoring Your Dynamic Cloud Infrastructure

Fully taking advantage of cloud infrastructure includes the ability to scale up and down dynamically, taking the need and load off your services. The compute services like Amazon Web Services (AWS) EC2, Azure Virtual Machines (VM), and Google Cloud Platform (GCP) Compute Engine allow Auto Scaling of the instances of the service. This helps manage the responsiveness and costs of your cloud services by ensuring that the instance counts go up and down depending on demand.

Monitoring Kubernetes in Production

Monitoring Kubernetes, both the infrastructure platform and the running workloads, is on everyone’s checklist as we evolve beyond day zero and into production. Traditional monitoring tools and processes aren’t adequate, as they do not provide visibility into dynamic container environments. Given this, what tools can you use to monitor Kubernetes and your applications?

Best practices for alerting on Kubernetes

A step by step cookbook on best practices for alerting on Kubernetes platform and orchestration, including PromQL alerts examples. If you are new to Kubernetes and monitoring, we recommend that you first read Monitoring Kubernetes in production, in which we cover monitoring fundamentals and open-source tools. Interested in Kubernetes monitoring?