Operations | Monitoring | ITSM | DevOps | Cloud

Latest News

Everything You Need to Know About the Splunk Plugin for Grafana

Last week on Slack: Eldin: Hey Christine, do you remember the first time you viewed a log file? Christine: Oh yes. I used Splunk as a support engineer and I remember. You? Eldin: I believe it was early 2000s. I was installing Slackware and a few network cards for a DIY router, and logs were critical. Hello again! We are Eldin and Christine from Solutions Engineering – a team at Grafana that is passionate about connecting people to our products – reporting back for duty.

January 2020 Outage Report

Welcome to 2020, where Google Drive can fail for some of you but not others, you can’t access your passwords, and you can’t withdraw cash on vacation. This stranded on a desert isle dream was reality in the month of January, which saw drama in the financial services and internet infrastructure sectors. January’s downtime reinforces just how connected we have become, and how reliant we are on infrastructure that can seemingly fail on a whim.

Help! My Collector is Down: Troubleshoot in 6 Steps

At the core of the LogicMonitor solution, there is the LogicMonitor Collector. The Collector is a small Java app installed on servers in your environment that collects monitored data from your various devices and then sends that data to LogicMonitor for retention and display. The Collector is what connects your environment to the cloud and allows you access from anywhere. However, sometimes these Collectors can go down, potentially leading to gaps in monitoring.

Decoupling Ruby: Delegation vs Dependency Injection

We've all worked with tightly-coupled code. If a butterfly flaps its wings in China, the unit tests break. Maintaining a system like this is...unpleasant. In this article, Jonathan Miles dives into the origins of tight-coupling. He demonstrates how you can use dependency injection (DI) to decouple code. Then he introduces a novel decoupling technique based on delegation that can be useful when DI is not an option.

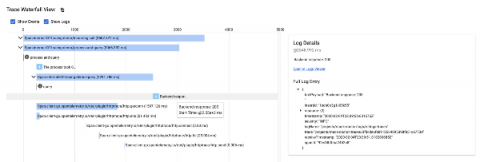
Integrating Tracing and Logging with OpenTelemetry and Stackdriver

One of the main benefits of using an all-in-one observability suite like Stackdriver is that it provides all of the capabilities you may need. Specifically, your metrics, traces, and logs are all in one place, and with the GA release of Monitoring in the Cloud Console, that’s more true than ever before. However, for the most part, each of these data elements are still mostly independent, and I wanted to attempt to try to unify two of them — traces and logs.

Introducing the Stackdriver Cloud Monitoring dashboards API

Using dashboards in Stackdriver Cloud Monitoring makes it easy to track critical metrics across time. Dashboards can, for example, provide visualizations to help debug high latency in your application or track key metrics for your applications. Creating dashboards by hand in the Monitoring UI can be a time-consuming process, which may require many iterations. Once dashboards are created, you can save time by using them in multiple Workspaces within your organization.

Essential Open Source Serverless Code Libraries

Serverless applications, due to their distributed nature, are often stuck having to reinvent the wheel. While small utility scripts and functions are often easily instrumented and monitored, anything of a transactional nature will need to implement special code to provide developers with common tools like stack traces, atomicity, and other patterns that rely on a singular flow of control.

How Can I Check My ElastAlert Rule is Configured Correctly?

Making sure that your ElastAlert yaml file is formatted and configured correctly. All of the below points will prevent alerts from being fired but there may not be an error message associated with the problem. It is possible you may need to contact support to investigate this issue for you. Make sure to proof read the rule you have written to ensure that it is what you expect to see as most of the issues regarding ElastAlert not working correctly is related to the points above.

Think You're a Proactive MSP? Think Again!

MSPs generate more MRR (monthly recurring revenue) when they’re able to reduce reactive noise and dedicate their resources to more proactive MSP tasks. This is because proactive tasks are predictable. They’re scheduled into our days (e.g., regular technology alignment visits, business impact and strategy meetings, centralized services, and projects). We know how much they cost and how long they take to complete. We know the margins on proactive tasks (if we price them properly).