Operations | Monitoring | ITSM | DevOps | Cloud

Latest News

Monitor Apache Airflow with Datadog

Apache Airflow is an open source system for programmatically creating, scheduling, and monitoring complex workflows including data processing pipelines. Originally developed by Airbnb in 2014, Airflow is now a part of the Apache Software Foundation and has an active community of contributing developers. Airflow represents workflows as Directed Acyclic Graphs (DAGs), which are made up of tasks written in Python. This allows Airflow users to programmatically build and modify their workflows.

How Tackle Creates Customer Trust with Sentry

Regardless of the strength of your product, and the quality of your code, if the end result isn’t happy customers… What’s the point? For Tackle, a software company dedicated to helping ISVs turn the Cloud Marketplaces into repeatable, sustainable, and significant sources of revenue, customer experience is everything. As a software company serving other software companies, Tackle knows exactly what matters most to its customers, which is why they use Sentry.

OpenTracing, OpenCensus & OpenTelemetry: What is Distributed Tracing?

Software monitoring allows developers and IT professionals to observe events occurring within a monitored system. The data gathered by monitoring processes offers visibility into how the monitored entity is behaving and provides warning signs indicating that some aspect of the system deserves greater attention. More and more software is migrating to the cloud, and monolithic software is being decomposed into microservices to create distributed applications.

Connecting Prometheus-Ksonnet to Grafana Cloud

In a previous post we showed how to install Prometheus and Grafana using the prometheus-ksonnet library along with Tanka. This is great for getting a well-managed monitoring install going, but sometimes it isn’t enough for monitoring larger clusters. If you have multiple clusters that you want to monitor on a single dashboard, or need long-term storage, or need a high-availability setup for your monitoring data, then this installation won’t be sufficient on its own.

Azure Monitor (Part 3): Azure Monitor Logs - Solutions

In the previous post, we talked about connecting data sources to your Log Analytics workspace. While the data can be super useful, it is “unstructured” at this point – not really in the right shape to perform a specific task or enable useful monitoring of an application or a service. This is where “Solutions” come into picture (formerly called management solutions). Solutions can also leverage other services in Azure to perform many related actions, such as automation.

All together now: our operations products in one place

Our suite of operations products has come a long way since the acquisition of Stackdriver back in 2014. The suite has constantly evolved with significant new capabilities since then, and today we reach another important milestone with complete integration into the Google Cloud Console. We’re now saying goodbye to the Stackdriver brand, and announcing an operations suite of products, which includes Cloud Logging, Cloud Monitoring, Cloud Trace, Cloud Debugger, and Cloud Profiler.

A Peek at the Top Tools for API Monitoring

An API allows two systems to communicate with each other. APIs (application programming interfaces) are magnificent things as they connect services and allow us to transfer data back and forth between managed systems. If you manage an API that internal and external users rely on, its failure won’t only impact you. It will affect all users and systems connected to the API. The connectivity and interdependencies create vulnerabilities for application programming interfaces.

A Comprehensive Guide to Migrating from Python 2 (Legacy Python) to Python 3

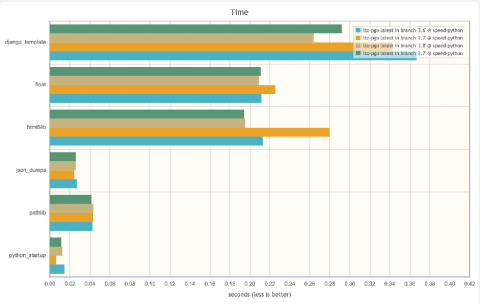
Python powers many applications we use in our day-to-day like Reddit, Instagram, Dropbox, and Spotify. The adoption of Python 3 has been a subject of debate in the Python community. While Python 3 has been out for more than a decade now, there wasn’t much incentive to migrate from the stable Python 2.7 in the earlier releases. If you’re still running on legacy python, it’s high time to migrate as it has reached the end of its life since Jan 2020.

Release 1.20: Kernel monitoring 'superpowers' and infrastructure-wide labels

In Netdata’s first major release of 2020, we’re introducing two new features on the opposite ends of the monitoring spectrum. On one hand, we’re releasing an eBPF collector, which lets you collect, monitor, and visualize incredibly precise metrics straight from the Linux kernel. On the other, we added the ability to label agents to help you organize entire infrastructures and see every important piece of information about streaming nodes in one place.