Operations | Monitoring | ITSM | DevOps | Cloud

Latest News

Selling SaaS in Europe

I’ve always enjoyed working at tech startups, and the journey which led me to join OpsRamp as the company’s first VP of Sales for EMEA began more than 20 years ago. I’ve learned a lot from working across diverse infrastructure categories, such as security, virtualization, storage, and identity management. Nobody was doing SaaS two decades ago, but there’s no question that today, IT is much more meaningful and powerful with the advent of cloud computing.

Greatly Reduced Server Loads

As explained in the last post we've spent a few weeks working on small fixes and improvements, focusing on jobs that aren't urgent but shouldn't be overlooked. Here we'll look at how a few simple code changes greatly increased efficiency when serving pages on the Downtime Monkey website. These improvements focus on reducing the server's CPU load and memory use.

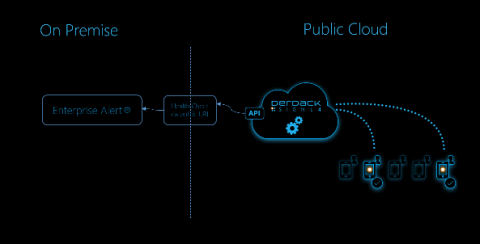
How to use SIGNL4 for availability monitoring of Enterprise Alert

Enterprise Alert is the leading enterprise-class software in automated communication and incident response providing push notifications, SMS text messages, voice calls and emails to deliver instant notifications. With two-way smart connectors, built-in duty scheduling, customizable escalation workflows, and remote actions there is not a worry that critical events are not received and are handled in a timely manner.

Network Security Monitoring with Suricata and Telegraf

At the end of 2019, we released a new Suricata input plugin with Telegraf 1.13.0. In this blog, I’ll talk about the the powerful combination of these two open source products — the importance of Suricata and why you should use Telegraf to monitor its performance. I wanted to start off first thanking Sascha Steinbiss for submitting this plugin. Here at InfluxData, we can’t tell you how much we value our open source community.

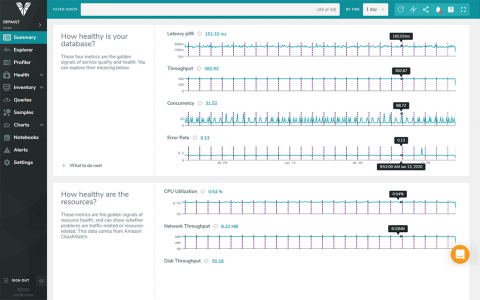
SolarWinds Deepens Hybrid IT Database Portfolio With Database Performance Monitor for Cloud-Native Environments

Before-and-after analysis and one-second root cause granularity for open-source and NoSQL databases, including MongoDB and PostgreSQL; uniquely enabling SolarWinds customers to manage databases through single provider

Key metrics for monitoring AWS Lambda

AWS Lambda is a compute service that enables you to build serverless applications without the need to provision or maintain infrastructure resources (e.g., server capacity, network, security patches). AWS Lambda is event driven, meaning it triggers in response to events from other services, such as API calls from Amazon API Gateway or changes to a DynamoDB table.

Tools for collecting AWS Lambda data

In Part 1 of this series, we discussed AWS Lambda functions and some key metrics for monitoring them. In this post, we’ll look at using Amazon’s native tooling to query those metrics. We’ll also show you how to collect logs and traces that provide further visibility into your Lambda functions. Amazon provides built-in monitoring functionality through CloudWatch and X-Ray.

Monitoring AWS Lambda with Datadog

In Part 2 of this series, we looked at how Amazon’s built-in monitoring services can help you get insights into all of your AWS Lambda functions. In this post, we’ll show you how to use Datadog to monitor all of the metrics emitted by Lambda, as well as function logs and performance data, to get a complete picture of your serverless applications. In this post, we will: Datadog integrates with AWS Lambda and other services such as Amazon API Gateway, S3, and DynamoDB.