Operations | Monitoring | ITSM | DevOps | Cloud
Latest News
Monitoring Setup Made Simple with Tanka and the Prometheus-Ksonnet Library
As mentioned in a previous post, at Grafana Labs we make heavy use of Tanka and the Jsonnet programming language to manage our Kubernetes infrastructure. One of the benefits of the use of Jsonnet is the depth of collaboration that it allows with others outside of your company. For example, the open source prometheus-ksonnet library can be used to install both Prometheus and Grafana.
How To Improve Application Health with Error Monitoring
Customer support teams are a crucial part of any enterprise service, and in the world of Governance, Risk, and Compliance (GRC) Software, these teams need to be focused on supporting critical customer needs, not troubleshooting application errors that have reached the customer. Sentry has proved to be a pivotal part of the toolset for industry-leading GRC software company Reciprocity.
Azure Monitor (Part 1): What is it and how does it work?
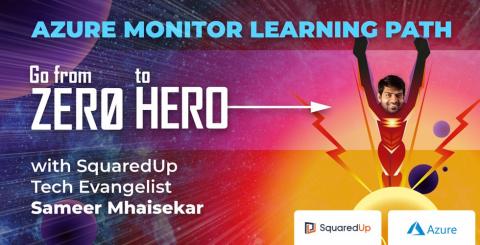
Join me on my Azure Monitor journey as I learn all there is to know about the platform. Check out my intro note here for a brief series overview and a bit about me (tl;dr former SCOM admin, avid tech blogger, SquaredUp tech evangelist). We’ll start with the basics and dive deeper as we go along. Buckle up, your journey to becoming an Azure Monitor superhero starts here!
How to get the most out of your ELB logs
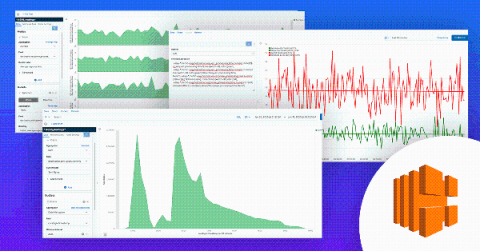
Amazon ELB (Elastic Load Balancing) allows you to make your applications highly available by using health checks and intelligently distributing traffic across a number of instances. It distributes incoming application traffic across multiple targets, such as Amazon EC2 instances, containers, IP addresses, and Lambda functions. You might have heard the terms, CLB, ALB, and NLB. All of them are types of load balancers under the ELB umbrella.
Best Practices for Moving from a Monolith to Microservices
In the first post of this series, we looked at the state of your organization, how to tell if Microservices are right for you, and wrapped up with a few challenges this architecture brings to the table. In this article, we will look at organizational changes that will help you adopt a Microservice architecture. Additionally, we will touch on topics like how to bring change to your organization, how to embrace the primacy effect, and why you should embrace cross-functional teams.
How to Identify Network or Server Resources as Root Cause to Slow Session Performance
Goliath Performance Monitor can help you isolate the root cause quickly so you can troubleshoot and resolve with permanent fix solutions. When trying to identify the root cause of a Citrix end-user experience issue, the main display where you can view all of the Citrix user sessions is the Virtual Apps & Virtual Desktops display.
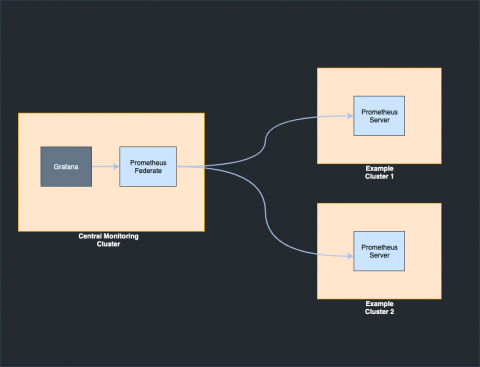
Monitoring a multi-cluster environment using Prometheus federation and Grafana
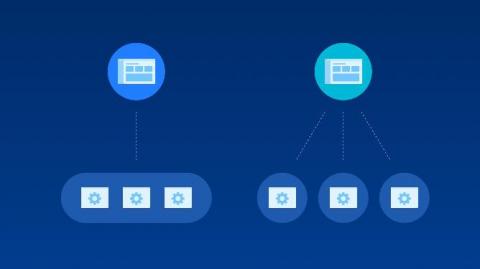
Monitoring the state of your clusters is an effective way to discover bottlenecks in your multi-cluster production environment. It is one of the key challenges that development teams are facing and factors such as the team experience as well as the number and distribution of the applications can make things even more complex. Better monitoring can help identify single points of failure.
Dear IT, Employee Engagement Is On You
Dear IT, Ten years ago you and I would have never discussed things like employee experience and engagement. We used to communicate in more defined terms. Admittedly, business needs were more centered on our customers, less on our own employees. But times have changed. This is the age of employee experience and if we don’t take it seriously, and involve IT all the way, our company we’ll get left behind.
Top 10 B2B Marketplaces a Startup Should Rely on for Fast Growth
Just as we are moving into more diverse entrepreneurial ideas, there is a massive revolution in executing the plans rightly. The advent of technology has not only brought solutions to revamp physical businesses but also introduced to avenues that are highly optimized and efficient in every sense. Many global sellers are always in the hunt of top B2B marketplace that offers a variety of features and services to help them grow faster.


