Operations | Monitoring | ITSM | DevOps | Cloud

Latest News

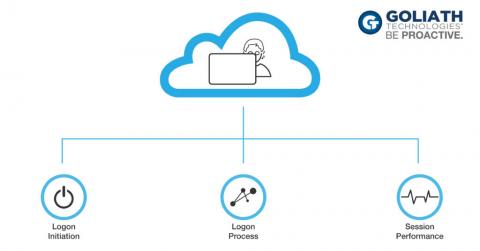
4 Cloud Infrastructure Monitoring Best Practices To Enhance End User Experience

I’ve seen so many new types of infrastructure technologies impact the performance of the modern data center. All-flash technologies help consolidate systems, virtualization helps to deliver powerful workloads to a variety of users, and even convergence has helped remove legacy from the data center. Most of all, these solutions are all coupled with the cloud to really help an organization become agile and much more efficient.

Join the Discussion on Sentry's Streamlined SDKs

If you use Sentry, you’re probably familiar with our SDKs. While they aren’t the only reason for Sentry’s success, they do play a very important role, from the first time an error is thrown to the moment you fix the bug. SDKs are often like political figures (editor’s note: there are so many things we resisted saying here) — you don’t notice them if they do a good job. Jokes aside, there are very few expectations for an SDK.

Use Case: Using Maintenance Windows to Set Up Alert Schedules

For many of our users reacting to downtime data sent from a monitoring system such as StatusCake.com is a 24 hour job, and the process incorporates many staff who will have varying responsibilities, and sometimes work quite different hours. This is particularly true of companies who run “follow-the-sun” with their global dev-ops teams picking up the baton from the last as their time zone starts its working day.

Migrating to 2.0: the good, the bad & the ugly

The Sensu 2.0 release is dropping in October, and we’re already excited! As the version numbering implies, Sensu 2.0 includes significant changes from Sensu 1.x. Not only has the software been entirely re-engineered in Go — easing deployment significantly — the exposed APIs and internal data structures have changed to accommodate new features.

Raygun and Java: Better error monitoring with Breadcrumbs and more

Raygun Crash Reporting has supported the Java Framework since we launched. As a Java customer, you’ve always been able to catch errors pre and post-production, receive alerts, and provide one source of truth for errors on your whole team. Now, Raygun provides full feature support for Raygun4Java. Java customers now have access to all our favorite Raygun features, like Breadcrumbs, offline support, web service support, and sensitive data filtering.

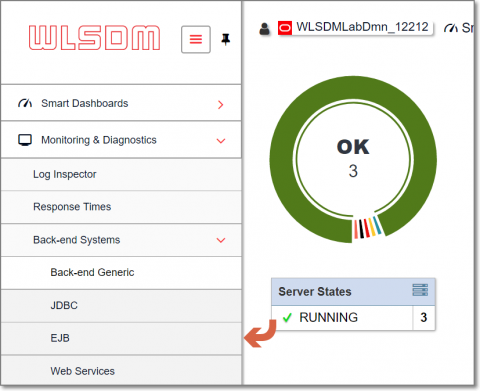
How to monitor JavaEE applications' EJB method performance on WebLogic?

Previously on WLSDM blog, we have learned about monitoring applications’ database statements (JDBC SQL) and performance on Oracle WebLogic server. In this blog post we have created another tutorial to learn how to monitor and diagnose WLSDM back-end EJB business method invocation events.

Monitoring Server Performance

This is the first in a series on server monitoring. The primary focus of these posts is monitoring in a *nix environment. Monitoring servers is important. Whether it be finding an issue in a test environment prior to deploying or debugging an issue in production, we need access to information on our server to be able to tease apart what went wrong.