Operations | Monitoring | ITSM | DevOps | Cloud

Latest News

MAUI provider upgrades v2: Real User Monitoring + Crash Reporting

I’ve written previously about the process of adding Real User Monitoring capabilities to our MAUI provider. I’m excited to say that this work is now live, batteries and all, plus some more improvements since the last blog. To recap the state of cross-platform development in the.NET ecosystem, Xamarin is out of support as of May 1st! This is replaced by.NET MAUI (Multi-platform App UI), meaning developers need appropriate tools when they make the switch.

Unlocking insights: Learn to deal with deadlocks and blocks with an SQL monitor

Deadlocks and blocks are two types of concurrency issues that can occur in an SQL Server environment. Understanding and addressing these issues is crucial for ensuring the performance and reliability of your SQL-based applications. First, let’s look at the concept of locks, blocks, and deadlocks.

How to Use Relational Fields: Some Nifty Use Cases

We recently introduced relational fields, a new feature that allows you to query spans based on their relationship to each other within a trace. You can now query for spans where its root span, direct parent span, or any other single span in the trace has certain attributes. We currently support the following three prefixes: root. - Identifies the root span within a trace. To find a match, any additional root. filters in your query will search through fields only in the specified root. span.

Database Monitoring: troubleshooting from the bottom up

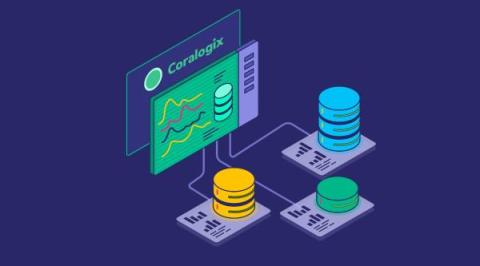
A healthy relationship between services and databases is fundamental to overall application performance. Unchecked database issues can compromise application efficiency, user experience, and ultimately, your organization’s bottom line. To steer clear of these consequences, monitoring your databases should be a key component of your observability—and with the launch of Coralogix Database Monitoring, it can be.

Data source security in Grafana: Best practices and what to avoid

Recently, an incorrect security report was published, claiming that there’s a SQL injection attack in Grafana. As we have communicated to the security researcher, this report is wrong. Authenticated users in Grafana have the same permissions as the user configured for the underlying data source.

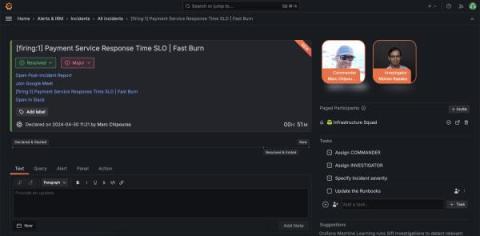
Grafana Incident: new tools for faster, simpler incident response

At Grafana Labs, we’re committed to helping teams dramatically improve how they manage and respond to incidents. Through Grafana Incident Response & Management (IRM), we provide tools to empower teams, streamline processes, and enhance the effectiveness of incident management strategies—and we’re constantly looking for ways to make our solution even better.

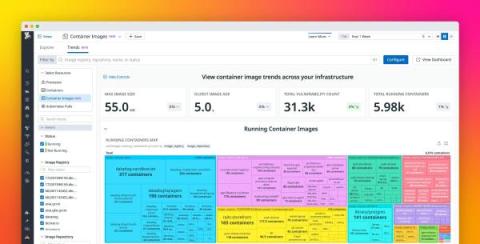
Track changes in your containerized infrastructure with Container Image Trends

Datadog’s Container Images view provides key insights into every container image used in your environment, helping you quickly detect and remediate security and performance problems that can affect multiple containers in your distributed system. In addition to having a snapshot of the performance of your container fleet, it’s also critical to understand large-scale trends in security posture and resource utilization over time.

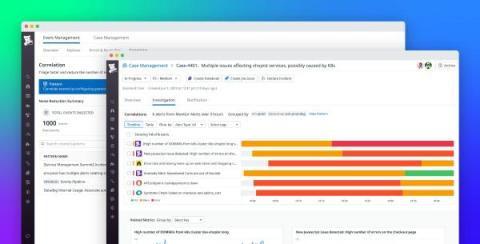
Aggregate, correlate, and act on alerts faster with AIOps-powered Event Management

Maintaining service availability is a challenge in today’s complex cloud environments. When a critical incident arises, the underlying cause can be buried in a sea of alerts from interconnected services and applications. Central operations teams often face an overload of disparate alerts, causing confusion, delayed incident response, alert fatigue, and redundant resolution efforts. These issues can negatively impact revenue and customer experience, especially during an outage.