Operations | Monitoring | ITSM | DevOps | Cloud
Latest News
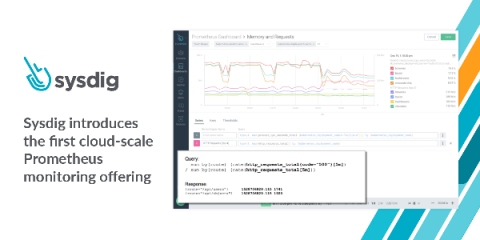
Sysdig Introduces the First Cloud-Scale Prometheus Monitoring Offering
Today, we are excited to announce a huge step forward for Sysdig Monitor. We’re introducing the ability for our customers to use Sysdig to scale Prometheus monitoring to millions of metrics with long-term retention. The improvements we are releasing make Sysdig the first cloud-scale monitoring offering to deliver full Prometheus compatibility.
Creating EKS Cluster with Windows 2019 Container Support
AWS EKS has been supporting Linux containers for a while. However, without Windows container support some of the hybrid applications were not supported end to end. In addition, with the version of 1.14 of Kubernetes, AWS introduced Windows container support and with this feature, you would be able to run Linux and Windows containers in the same Kubernetes cluster namespaces thus enabling your hybrid applications to work on Kubernetes.
Dashbird vs. AWS CloudWatch
At this moment, billions of people are rushing to the internet for work, entertainment, shopping - everything, really. It’s great that we developed this virtual world and can keep the lights on, despite what’s happening outside. On the other hand, cloud systems and developers are under pressure to meet an unparalleled demand. At Dashbird, we have always thought developers deserve the most efficient tools to discover and resolve issues in order to keep cloud apps running smoothly.
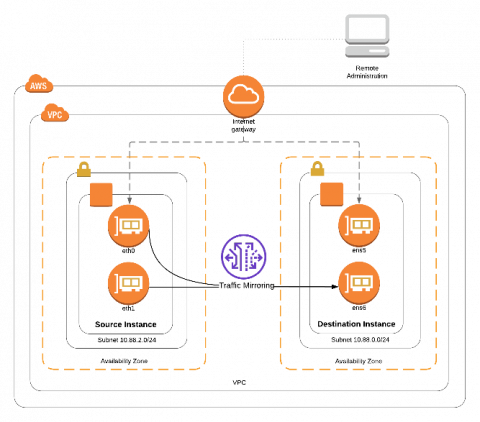
Amazon VPC Traffic Mirroring
How I Built a Machine Learning Pipeline on AWS for Under $7 a Day
Andreessen Horowitz recently published a blog about the Heavy Cloud Costs and Scaling Challenges of The New Business of AI, in which they describe how AI companies are facing cloud cost challenges, which are impacting their margins. As someone who used to manage a fully home-grown on-site distributed speech recognition platform for an industry leader, I know firsthand that ML can be expensive and challenging to maintain. However, it doesn’t have to be.
Azure Functions Live - March 2020
Observations on ARM64 & AWS's Amazon EC2 M6g Instances
At re:Invent in December, Amazon announced the AWS Graviton2 processor and its forthcoming availability powering Amazon EC2 M6g instances. While the first-generation Graviton processor that powered A1 instances was better suited to less compute-intensive workloads, this processor is intended to offer AWS customers a compelling alternative to conventional x86-powered instances on both performance and cost.
Introducing Grafana Cloud Agent, a remote_write-focused Prometheus agent that can save 40% on memory usage
Today, we are announcing the Grafana Cloud Agent, a subset of Prometheus built for hosted metrics that runs lean on memory and uses much of the same battle-tested code that has made Prometheus so awesome. At Grafana Labs, we love Prometheus. We deploy it for our internal monitoring, use it alongside Alertmanager, and have it configured to send its data to Cortex via remote_write. Unfortunately, as we scale to handle more load, our deployment becomes more and more difficult to manage.
Serverless CI/CD: How we added a staging step
Unit tests and integration tests are vitally important, but sometimes even those aren’t sufficient to ensure that critical services in your application will function smoothly in production. In those cases, adding a staging step to our CI/CD process allows us to test a feature with real data in a less supervised environment. For example, here at Lumigo we decided to use it for our Node.js tracer.


