Operations | Monitoring | ITSM | DevOps | Cloud

Latest News

How We Use PagerDuty for Emergency Response

PagerDuty is known as the platform for driving real-time work, and with the current global spread of COVID-19, many of our customers have been asking how we leverage PagerDuty internally to intelligently coordinate a response to emergency situations (such as this) as they arise. PagerDuty customers primarily leverage our platform for coordinating an incident response process when technical issues happen, such as a bad deployment, network degradation or failed hardware.

Network Telemetry - An IT Executive's Guide

Telemetry is the collection of measurements or other data at remote or inaccessible points and their automatic transmission to receiving equipment for monitoring. In network telemetry, network devices such as routers, firewalls and switches push real-time data continuously to one or more centralized locations for storage, processing and analysis.

How to get started with Elasticsearch Service on AWS GovCloud

We’re happy to announce the beta availability of our new government region, AWS GovCloud (US East), for the Elasticsearch Service on Elastic Cloud. This new region is our first step in simplifying operations for Elastic users who handle government data as we work toward gaining a Moderate authorization for the Federal Risk and Authorization Management Program (FedRAMP).

Jaeger data analytics with Jupyter notebooks

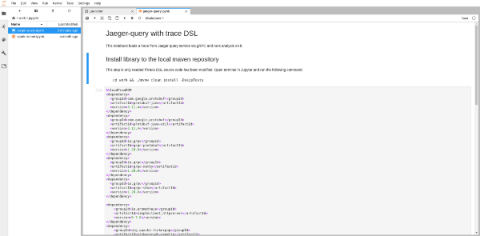
In the previous blog post Data analytics with Jaeger aka traces tell us more! we have introduced our data science initiative and platform. The ultimate goal is to develop new functionality within the Jaeger project based on AI/ML that will provide new insights into our applications. This type of functionality is also referred to as AI operations (AIOps). Jupyter notebooks provide a simple user interface for experimenting with data.

How Auvik Can Help Keep Networks Steady During the COVID-19 Pandemic

Your phone is ringing off the hook. Another client is calling, trying to figure out how to ensure their team can continue to be productive in the wake of the COVID-19 pandemic. Even though these are extraordinary times, your role as the IT professional hasn’t really changed. Your job is to make sure your clients are productive and they can still access the resources, tools, and applications they need to do their jobs.

Announcing Ticketing

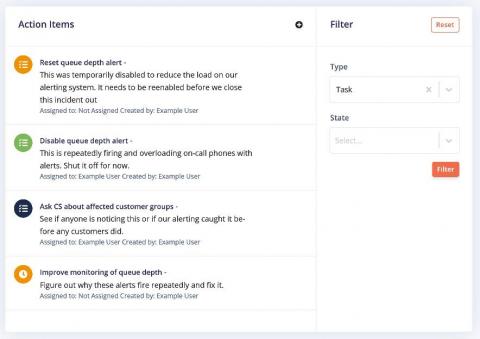
Incidents come up quickly and tracking critical tasks to be done in the moment and after an incident is resolved it can be challenging to keep up with what was done by who during an incident and what tasks still need to be completed. In an effort to continue simplifying your incident response process today we are happy to announce an overhaul of ticketing and task tracking on FireHydrant along with a major overhaul of our JIRA integration.

The Top 9 Best Practices for Monitoring Your Server

Has your phone gone in the middle of the night when your boss is calling because the server is down? Maybe you wake up to a tone of text messages that something is wrong with the server? If you have encountered this, then you know the importance of monitoring your server so that you are not the last to know when there is a problem. Part of server monitoring is putting best practices in place to ensure you are prepared for the unexpected.

Monitoring event pipelines: Why you need one, and why you should stop rolling your own

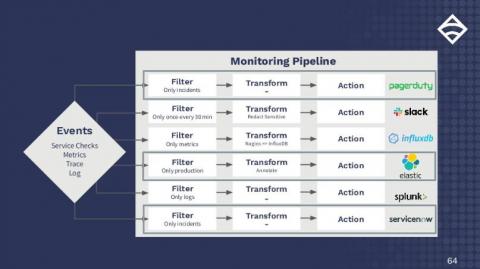
Over the last 10 years, the landscape that we manage, maintain, and control as operators and developers has changed dramatically. We’ve shifted from monolith to microservices, from bare metal to VMs to containers to function-based computing — and it’s changed how we need to approach monitoring and observability.

HTTPS sites using TLS 1.0 and TLS 1.1 are to be blocked by browsers by the end of the March 2020

The end of TLS v1.0 and v1.1 is near – the most popular browsers will either display a warning message when you visit a TLS 1.0/1.1 site or require user intervention and confirmation to connect to the website.

In Observability, RED is the New Black

When it comes to complex application integrations, RED monitoring provides a sensible and necessary common element to see how our systems are performing and to alert us to behavior which is detrimental to your customers and your business goals. So, what is RED? RED stands for rate, errors, duration and is an offshoot of the Google Golden Signals.