Operations | Monitoring | ITSM | DevOps | Cloud

Latest News

Sysdig 2019 Container Usage Report: New Kubernetes and security insights

We’re excited today to release the Sysdig 2019 Container Usage Report. Continued momentum for Kubernetes and greater adoption of cloud-native architectures are changing not just usage patterns, but processes and organizational structures as well. One of the surprising insights this year is the 2X increase in the number of containers that live for less than five minutes. As services grow more dynamic, cloud teams are recognizing the need to integrate security into their DevOps processes.

Image scanning for Azure Pipelines

In this blog post, you’ll learn how to setup image scanning for Azure Pipelines using Sysdig Secure DevOps Platform. Azure DevOps gives teams tools like version control, reporting, project management, automated builds, lab management, testing, and release management. Azure Pipelines automates the execution of CI/CD tasks, like building the container images when a commit is pushed to your git repository or performing vulnerability scanning on the container image.

Monitoring Amazon RDS with Blue Matador

Amazon RDS allows you to easily run databases in AWS without actually having to manage database servers. Since your databases are critical to the health of your application, properly monitoring RDS is a top priority for most teams. In this blog post, we will go over how Blue Matador monitors RDS automatically and without configuration.

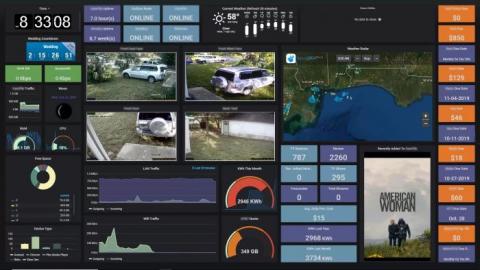
How to Set Up This Next-Level Personal Home Dashboard in Your Kitchen

We saw Cameron’s impressive dashboard in a Grafana Experts Facebook group and asked him to break it down for us. When friends and visitors see my personal home dashboard in my kitchen, they’re normally of the opinion that it’s “really neat” and looks “impressive.” Often that’s what they take away from it. It’s “cool”… and as much as that may be true, that is not its purpose.

Troubleshoot Citrix & VMware Horizon Deployments

IT spends millions of dollars and years of worker-time so their workforces can work anywhere, anytime, on any device, securely. And a huge chunk of that investment is in VDI from Citrix or VMware Horizon, both on-prem and in the cloud. As a result, IT, you’ve delighted your end-users with a super high-performing, super reliable end-user experience, right?

Monitoring Azure MariaDB Instances with LogicMonitor

Released in 2009, MariaDB is a popular open-source fork of the MySQL relational database management system. MariaDB is intended as a drop-in replacement for MySQL, so data and table definitions, protocols, structures, and connectors require little to no modification in order to migrate. MariaDB also contains several enhancements, including faster indexes and cache, increased connection thread pools, and support for more storage engines.

What is a post mortem incident? How can we monitor this?

In particular, I liked very much the article that our colleague Sara Martin wrote in Pandora FMS blog about crisis management in information technology, these are the steps: Legend: “Jack’s Lantern (https://commons.wikimedia.org/wiki/File:Jack-o-lantern.svg) This article starts from point number five: when after a certain time of recovery the crisis has been solved and becomes a post mortem incident. This word comes from the Latin language and it means “after death”.

How to Manage a Critical Incident

Critical incidents don’t come with a predetermined schedule or warning. So, it’s up to your organization to have an incident response procedure in place to combat these crises. Don’t have one? Read below to perfect your incident response operations and adopt the right tools and procedures to fight against any critical event.