Operations | Monitoring | ITSM | DevOps | Cloud

Latest News

SSI Selects Goliath Technologies to Proactively Troubleshoot and Document Citrix End-User Experiences

Goliath adds SSI to a growing list of managed service partners Philadelphia, PA – July 21, 2020 – Goliath Technologies, a leader in end-user experience monitoring and troubleshooting software, announced today a new partnership with SSI, a global IT and cloud managed service provider. Goliath adds SSI to its growing list of managed service partners which includes HCL, Tech Mahindra, MTM, DXC, and many others.

Puppet Enterprise new release offers powerful orchestration and more

As the industry leader in the DevOps space, we’re excited to share recent updates to the Puppet Enterprise platform that give infrastructure operations teams the flexibility to manage and automate more infrastructure and complex workflows in a simple yet powerful way.

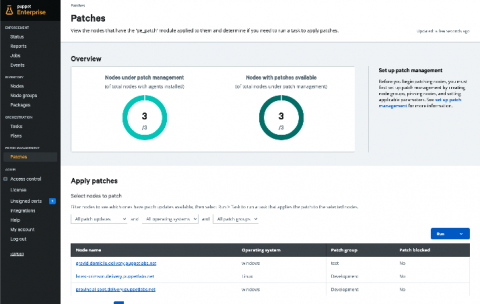
Standardize and automate patching workflows with Puppet Enterprise

Patching systems is not a new problem; this is something that organizations are very familiar with. Organizations have tried solving this issue in various ways by cobbling together multiple tools, processes, different teams, and more. Organizations are constantly trying to stay secure and keep their systems up to date, but patch management isn’t a simple process. In fact, applying the patch itself is just one part of the overall workflow, which involves multiple teams and various steps.

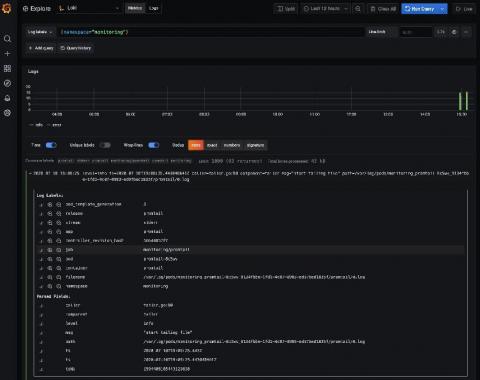
Loki tutorial: How to send logs from EKS with Promtail to get full visibility in Grafana

Amazon Elastic Kubernetes Service (Amazon EKS) is the fully managed Kubernetes service on AWS. If you’re using it and wondering how to query all your logs in one place, Loki is the answer. With this tutorial, you’ll learn how to set up Promtail on EKS to get full visibility into your cluster logs while using Grafana. We’ll start by forwarding pods logs then nodes services and finally Kubernetes events.

LM Logs: A Mission to Decrease MTTR by Bringing Metrics and Logs Together

Imagine it’s 3 AM, you’ve just been paged for a critical issue- queues filling up quickly, and you don’t know why. You turn to logs, looking for something abnormal, a change that could explain what is happening so you can fix it. Sound familiar? Unfortunately, searching through logs to uncover changes is a time-consuming process.

AWS Fargate pricing: how to optimize billing and save costs

AWS Fargate is a managed service that enables you to run containers in Amazon Elastic Kubernetes Service (EKS) or Elastic Container Service (ECS). Since Fargate is serverless, you don’t need to provision or manage servers or clusters. However, you do need to set up package containers, define resource requirements, and configure permissions and networking policies. Fargate pricing is determined according to virtual CPUs (vCPUs) requirements, as well as usage of GBs of RAM for running services.

12 Container image scanning best practices to adopt in production

Don’t miss out on these 12 image scanning best practices, whether you are starting to run containers and Kubernetes in production, or want to embed more security into your current DevOps workflow. One of the main challenges your teams face is how to manage security risk without slowing down application delivery. A way to address this early is by adopting a Secure DevOps workflow.

Onelogin Log Insights with Coralogix

OneLogin is one of the top leading Unified Access Management platforms, enabling organizations to manage and Access their cloud applications in a secure way. OneLogin makes it simpler and safer for organizations to access the apps and data they need anytime, everywhere. This post will show you how Coralogix can provide analytics and insights for your OneLogin log data – including performance and security insights.