Operations | Monitoring | ITSM | DevOps | Cloud

Latest News

Generate process metrics to analyze historical trends in resource consumption

Your application’s health depends on the performance of its underlying infrastructure. Unexpectedly heavy processes can deprive your services of the resources they need to run reliably and efficiently, and prevent other workloads from executing. If one of your applications is triggering a high CPU or RSS memory utilization alert, the issue has likely occurred before.

Getting Started with Sematext Browser SDK for Front-end Performance Monitoring

Open-sourcing a code base for the world to see after working on it for a long time is a great experience. You should care about what your users want. You want your users to have a great experience using your product. Everything has to fall into place. Performance, responsiveness, user experience, etc. all have to be exceptional. That’s why I think front-end performance metrics are crucial.

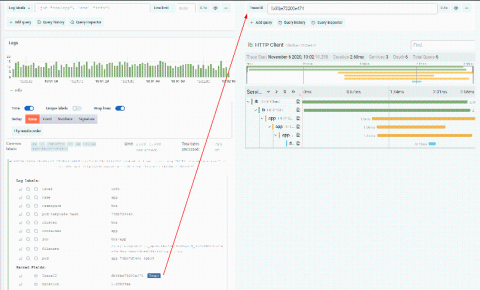
Trace discovery in Grafana Tempo using Prometheus exemplars, Loki 2.0 queries, and more

Grafana Tempo, the recently announced distributed tracing backend, relies on integrations with other data sources for trace discovery. Tempo’s job is to store massive numbers of traces, place them in object storage, and retrieve them by id. Logs and exemplars allow users to quickly and more powerfully jump directly to traces than ever before. Let’s dig into some examples with a live playground to try it out!

How to Minimise your Azure Blob Storage Costs

We all know that while Microsoft provides an almost seemingly infinite amount of storage. Compare this to your normal datacentre virtual infrastructure, you often need to do some capacity planning for expected Virtual Machine Compute and Storage way ahead of time. As Microsoft does the capacity planning for you (and everyone else who is using their services), your own Operational Support no longer needs to order disks or more servers to keep up with your business growth and expectations.

vSphere 7 with Tanzu Integrates with HAProxy for Load Balancing Enterprise-grade Kubernetes

VMware chose HAProxy as the default load balancer for Tanzu Kubernetes clusters, which helped streamline load balancing in their Kubernetes platform. VMware has delivered vSphere 7 with Tanzu, its endeavor to embed an enterprise-grade version of Kubernetes inside vSphere, the industry-leading compute virtualization platform.

Console Connect Ecosystem Update November 2020

The Console Connect ecosystem is rapidly expanding. To help you keep up-to-speed, each month we are bringing you updates on all our latest data centre, cloud and SaaS interconnect locations, as well as introducing you to some of our newest ecosystem partners. Now, we’ve extended your reach even further! In the last month, we have on-boarded new data centres, cloud locations and new SaaS partners!

Monitoring 101: The Fundamental Concepts of System Monitoring

The answer to troubleshooting network challenges lies in effectively monitoring your environment. But saying “let’s monitor our network” presumes you know what you should be looking for, how to find it, and how to get it without affecting the system you’re monitoring. You’re also expected to know where to store the values, what thresholds indicate a problem situation, and how to let people know about a problem in a timely fashion.

COVID-19 & Work-at-Home Trends Mean Simplified Networking Processes

In 2020, business networks faced one of their biggest challenges since the dawn of the digital age – the sudden, completely unexpected worldwide disruption brought on by the COVID-19 coronavirus outbreak. Suddenly networks – and network admins – had to quickly adapt to a new networking paradigm, one where as many workers as possible were stationed at home.

Myth busted: Kibana isn't just for developers - it's for everyone

Kibana is for everyone. As the creators of the Elastic Stack, we get a lot of feedback when chatting with our users from all corners of the world during ElasticON events, in GitHub and forums, and while helping folks resolve their support cases. One of the things we've heard in the past is that Kibana is difficult to use. And we've listened to our community!

What's a "normal" amount of Lambda functions?

2020 – what a ride it’s been! The state of the world this year has definitely been unpredictable and ever more surprising. So for some interesting insights and stability, we’ve turned to Lambdas. Namely, the state of Lambda functions in 2020! Ever wondered how others look without their face masks on? At Dashbird, we get to (metaphorically speaking) see what everyone looks like behind their serverless masks (read: stacks), and identify trends and patterns.