Operations | Monitoring | ITSM | DevOps | Cloud

Logging

The latest News and Information on Log Management, Log Analytics and related technologies.

Guide to Logging Your IBM Cloud Resources with LogDNA

We hope you’re enjoying your time at IBM Think 2019 – thank you for dropping by to chat with our team (at booth 598) and now checking our blog. As promised, setting up modern logging for your Kubernetes clusters on IBM Cloud is really easy and in this article we’ll take a closer log at IBM Log Analysis with LogDNA and how to use it to log your cloud Kubernetes clusters.

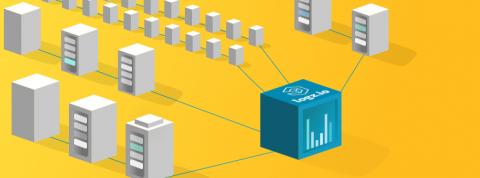
Server Monitoring with Logz.io and the ELK Stack

In a previous article, we explained the importance of monitoring the performance of your servers. Keeping tabs on metrics such as CPU, memory, disk usage, uptime, network traffic and swap usage will help you gauge the general health of your environment as well as provide the context you need to troubleshoot and solve production issues.

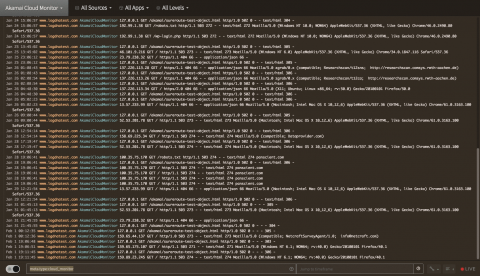
How to Send Akamai Logs to LogDNA

Akamai provides the Content Delivery Network (CDN) which is a highly-distributed platform of servers optimized to deliver contents including web and media applications. These networks enable applications to easily serve content from closer to their end users. Centralizing Akamai logs increases the ability to observe the end to end application and service delivery. LogDNA is proud to enable integration with Akamai to provide better observability and a unified view for our customers.

Logging Levels 101

If you’re a software developer, then you understand how vital application logging is in software development and a critical part of logging is something called logging levels. Log entries generally contain essential information—such as a timestamp, a message, and sometimes additional stuff like an exception’s stack trace. Those pieces of information are useful because they allow someone reading the log entry to understand how the application behaved in production.

Kafka Logging with the ELK Stack

Kafka and the ELK Stack — usually these two are part of the same architectural solution, Kafka acting as a buffer in front of Logstash to ensure resiliency. This article explores a different combination — using the ELK Stack to collect and analyze Kafka logs. As explained in a previous post, Kafka plays a key role in our architecture. As such, we’ve constructed a monitoring system to ensure data is flowing through the pipelines as expected.