Operations | Monitoring | ITSM | DevOps | Cloud

%term

VirtualWisdom 6.2 Has the Industry Talking

Earlier this month we announced the latest iteration of our award-winning hybrid IT infrastructure management and AIOps platform, VirtualWisdom. This was one of our biggest product-related announcements of the year, and we were thrilled with the response we received not only from our partners and customers, but also from the media and analyst community. Let’s take a look at what some folks had to say about the new VirtualWisdom.

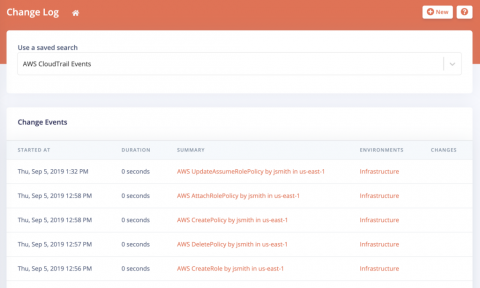
Announcing our AWS CloudTrail Integration

One of the most common reasons for system failures is changes to the underlying infrastructure. Amazon CloudTrail does a great job of recording when actions are taken but a lot of organizations don’t take advantage of it. FireHydrant now includes this data, giving you visibility into changes to your infrastructure while you’re investigating an incident.

Automating Critical Incident Management; Easier Than You Think

Organizations need to continually ramp up and improve their security and resilience to unexpected incidents. But as the number of endpoints, networks, and user interfaces grow exponentially, the task becomes more difficult, and manual incident response management becomes less and less effective.

The Secret Lives of Failed Amazon SQS Messages

A common pattern in serverless architecture is to have a queue before a function. This is great because you can create a second queue for all of the messages that failed in the function execution (or, if we want to put it in terms that don’t sound like we’re aggressively shaming them, we can classify them as having “encountered an error at some point”). This second queue is known as a “dead letter queue” or DLQ for short.

Local Variables and Function Arguments for Native Crash Reports

BugSplat now includes local variables and function arguments for our Windows Native, Unity, and Unreal C++ integrations. By including local variables and function arguments, we can provide another level of contextual information about the cause of your crash. This new feature may help reduce or eliminate the need to debug a crash report on your local development machine.

From Homegrown to Hosted: How The Trade Desk Migrated to a Modern Monitoring System with Grafana Cloud

When Patrick O’Brien interviewed to become a Site Reliability Engineer at The Trade Desk™, it was clear that taking the company’s monitoring system to the next level was the priority. “A chunk of my interview was about The Trade Desk’s previous monitoring system and how to scale it,” says O’Brien, who joined The Trade Desk more than two years ago. “I had a good feeling that would be an early task.”

Key Trends in Logging Workflows

Logs have been around since the advent of computers and have probably not changed all too much since. What has changed, however, are the applications and systems generating them. Modern architectures — i.e. software and the infrastructure they are deployed on, have undergone vast changes over the past decade or so with the move to cloud computing and distributed environments.

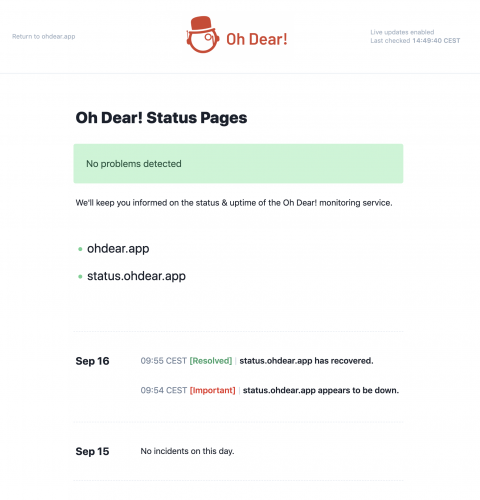
Introducing status pages for all our users!

We're proud to introduce a new major feature to all our Oh Dear users: Status Pages! All our users will now find a Status Pages feature in their dashboard, in the top level navigation. It allows you to create one or more status pages to keep your users informed in case of downtime or emergency. We're not limiting the amount of status pages you can create. You're free to create 1 or 100, it's all up to you.