Operations | Monitoring | ITSM | DevOps | Cloud

%term

The hidden challenges of Internet Resilience: Key insights from 2024 report

The result of responses from over 300 digital business leaders in North America and EMEA across technology platform providers, financial services, retail, and other industries, our research showed that almost half the surveyed organizations are losing upward of $1M monthly in terms of total economic impact (TEI) due to outages and service degradations.

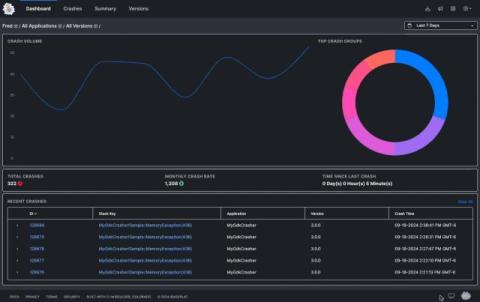
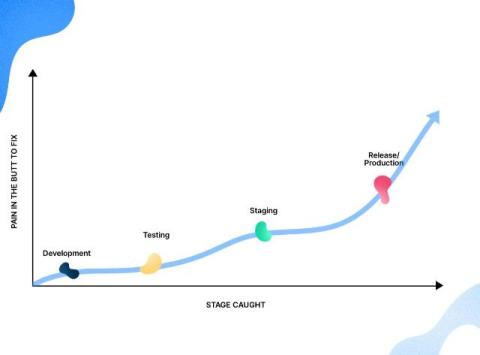
Why Early Crash Reporting Saves Time and Prevents Costly Bugs

At BugSplat, we always advocate for teams to introduce crash reporting and establish a bug-tracking/bug-fixing workflow early in their development process. So you can imagine my excitement when I found myself at Denver Startup Week chatting with the founder of a startup that has several projects in flight. He mentioned they’d just kicked off development of a new application, and things were moving quickly.

Using Trace Data for Effective Root Cause Analysis

Solving system failures and performance issues can be like solving a tough puzzle for engineers. But trace data can make it simpler. It helps engineers see how systems behave, find problems, and understand what's causing them. So let’s chat about why trace data is important, how it's used for finding the root cause of issues, and how it can help engineers troubleshoot more effectively.

Cost Guide: How to Manage IT Costs Effectively

In this article, you will learn effective ways on how to manage IT costs. Recently, IT departments face increasing pressure to reduce costs while maintaining high-quality services. A McKinsey and University of Oxford study found that large IT projects, on average, run 45% over budget and 7% over time while delivering 56% less value than predicted. This alarming trend emphasizes the need for effective IT cost management strategies.

What is Network Device Monitoring & How to Configure It? | Obkio NPM Onboarding Series

In this video, we’re looking at the “Network Devices” tab in Obkio’s Network Performance Monitoring App. Here you monitor network devices using SNMP polling and configure network device monitoring. Obkio collects different network metrics about the network device, mainly the CPU usage of the device in question, as well as information about the bandwidth of the ports.

Enhancing Transparency in Incident Alerting with SIGNL4

Effective incident alerting is crucial for businesses to maintain smooth operations and customer satisfaction. Incidents often generate multiple alerts, each requiring timely and transparent handling to ensure a swift resolution. Ensuring transparency throughout the incident alert process can be challenging. This is where SIGNL4 steps in, offering a comprehensive solution that enhances transparency at every step of incident alert handling.

Grafana for beginners: Quick tips to add a data source, choose a visualization type, and more

In the observability space, ease-of-use has always been a key differentiator for Grafana. As much as we want to offer a powerful observability platform to our users, we also want to ensure they can get up and running as quickly as possible. Still, for those of you sitting down to build your first dashboard, we totally understand that a little guidance can go a long way.

Why I like discussing actions items in incident reviews

Are incident reviews about learning or tracking actions? This question has sparked recent debate in incident management circles, including in my recent panel at SEV0 and in Lorin Hochstein’s post. Should the goal of an incident review be learning, or should it focus on tracking actionable improvements? When is the right time to discuss actions, and are they picked up just to make us feel better? From my experience, learning from incidents and identifying actions are inseparable.