Operations | Monitoring | ITSM | DevOps | Cloud

Logit.io

Top Prometheus Interview Questions

If you are an engineer searching for a new role that involves a high level of knowledge on the monitoring stack Prometheus then you will likely wish to brush up on your knowledge of Prometheus ahead of your interview. In this guide, you will find a list of the most popular questions that are most likely to be asked to candidates looking to use Prometheus as part of their daily monitoring stack within their next role.

Logit.io Launches Further Improvements To Alerting & Monitoring

We are happy to announce today that we have launched further improvements to the Logit.io platform’s alerting and monitoring features. This latest release of the Logit.io platform offers our users an improved workflow to assist with their productivity on the platform as well as a more updated intuitive user interface (UI).

Logit.io Announces The General Availability of OpenSearch

You may remember from our previous update (published August 2nd 2021) that we announced our initial support for the beta version of OpenSearch, well today we are pleased to announce that we’ve recently launched OpenSearch & OpenSearch dashboards 2.0.0 available for all platform users to use from today.

The Best Production Monitoring Tools & Software For 2022

As a software engineer running applications in production, it is essential to monitor this environment to maintain the health of your applications. Production monitoring software and systems are used to improve observability so that you can better understand your operating environment and visualise performance issues easily.

What is OpenTelemetry

You may have previously heard about OpenTelemetry (also known as OTel) if you have looked into improved ways of standardising different data types. In this article, we’ll delve into the key things you need to know about OpenTelemetry and how this unified standard may become the future of how logs, metrics, events and traces are all handled.

Interview With CTO, Leonard Trigg

For the next interview in our series speaking to technology specialists from around the world, we’ve welcomed experienced CTO, Leonard Trigg. Leonard is a member of the Harbourfront executive management team and serves as the firm's Chief Technology Officer. Joining the industry in 1995 Leonard has a background in enterprise technology, finance and operations. Leonard previously served as the Chief Operating Officer and Director at Vertex One Asset Management Inc.

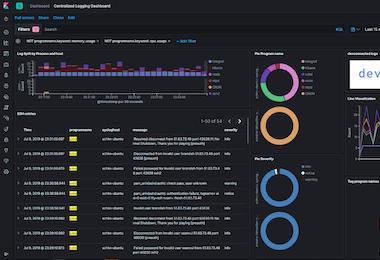
What is Kibana? (Updated Guide For 2022)

Kibana is a popular user interface used for data visualisation and for creating detailed reporting dashboards. This piece of software notably makes up a key part of the Elastic Stack alongside Elasticsearch and the extract, transform and load (ETL) tool, Logstash. In this comprehensive introduction to Kibana, we are covering all of the basics that you will need to know as a user considering using Kibana for your log data visualisation and reporting needs.

A Guide To Continuous Integration

Before continuous integration was invented, developers had to work on code separately before merging it into the end product. This technique had a high chance of error. If something was left out, it took time to determine the problem. Furthermore, communication between team members became difficult as the project grew. The larger the project, the more developers, engineers, and project owners were supposed to be faithful to each other’s schedules.

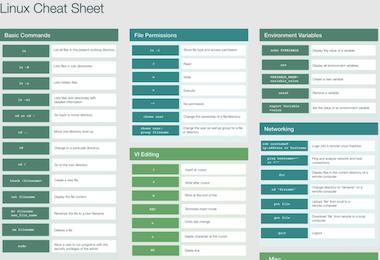
Linux Command Cheat Sheet

As we know that many of our users are system administrators, network and software engineers as well as cloud infrastructure leaders who use Linux primarily, we've created a helpful cheat sheet as a reference guide to help you with understanding the most common Linux commands. Feel free to save the sheet below and share it with any team members that you think would appreciate learning some of the most essential commands for Linux.