Operations | Monitoring | ITSM | DevOps | Cloud

Dashboards

Cortex v1.1 released with improved reliability and performance

Today we’re releasing Cortex 1.1, the first (minor) release since Cortex went GA in March, over 6 weeks ago. This release represents more than 140 commits by over 30 different authors from 9 different companies. In this post we’re going to give you some of the highlights of this release.

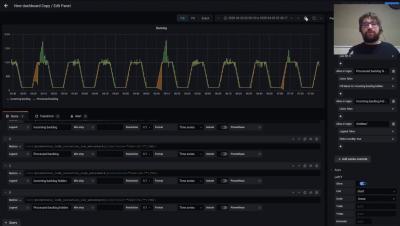
GrafanaCONline: Chrome browsing data to Grafana - as you browse

This session covers using variables to combine weather records and forecasts to measure a beehive – and how this can help beekeepers. We’ll also show how to compare particulate-matter (PM) measurements of nearby stations from different networks and develop a humidity-correction for low-cost PM sensors within a Grafana dashboard.

GrafanaCONline Day 6 recap: The power of Tanka, and a peek into the world of beehive monitoring with Grafana dashboards

GrafanaCONline is live! We hope you’re able to catch the great online sessions we have planned. If you aren’t up-to-date on the presentations, here’s what you missed on day 6 of the conference.

GrafanaCONline: What's the bee-weather & how to correct particulate-matter readings

This session covers using variables to combine weather records and forecasts to measure a beehive – and how this can help beekeepers. We’ll also show how to compare particulate-matter (PM) measurements of nearby stations from different networks and develop a humidity-correction for low-cost PM sensors within a Grafana dashboard.

GrafanaCONline: Tanka: Declarative Dashboards for Declarative Clusters

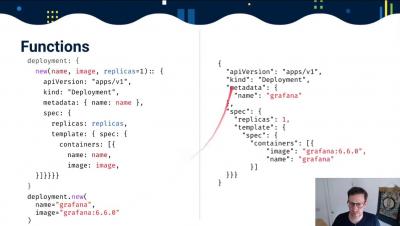
Tanka is a powerful tool for managing Kubernetes resources using the Jsonnet language. Along with a demonstration of deploying Grafana to Kubernetes using Tanka, this session will cover the benefits of deploying your dashboards alongside your code, how to manage Kubernetes resources using Tanka and Jsonnet, and how to create dashboards using Grafonnet and deploy them with Tanka.

Painting with Data: Choropleth SVG

With the release of the Splunk Enterprise Dashboards Beta version 0.5.2 comes an exciting new feature that I’m sure many people will find useful: Choropleth SVG Objects. What are Choropleth SVG Objects? Put simply, it’s painting with data. To help you navigate getting started with the current iteration of this feature, I’m writing a blog to show you just how easy it is to use and create absolutely custom SVG objects.

GrafanaCONline Days 3 & 4 recap: All about Grafana v7.0, the future of Prometheus, and the observability tools every company needs

GrafanaCONline is live! We hope you’re able to catch the great online sessions we have planned over the next couple of weeks. If you haven’t had a chance to tune in lately, here’s what you missed on days 3 and 4 of the conference.

GrafanaCONline: Nissan Leaf -> cloud all the things

Come join me on an adventure to analyze and improve my driving behavior and driving routes to get the most range out of my all-electric Nissan Leaf. You will get to see how you can use Grafana, Cortex, Loki, and other amazing open source technologies on a $35 Raspberry Pi to process and store over 1000 messages/second from the vehicle CAN bus along with GPS data and even camera images!