Operations | Monitoring | ITSM | DevOps | Cloud
Dashboards
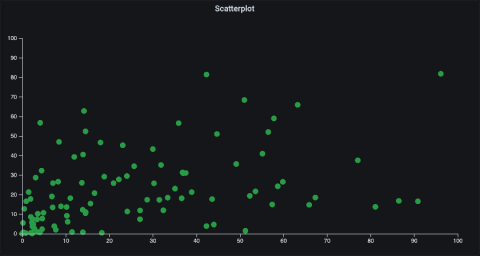
Learn Grafana: How to build a scatter plot plugin in Grafana 7.0
There are a lot of great things about Grafana 7.0, but one of my favorite features is the new React-based plugin platform, which has a set of new APIs and design system to help you build your own plugin. The process is easier and faster than ever. In this blog post, I’ll show how you can create a panel plugin for visualizing scatter plots. A scatter plot is a type of graph that displays values for (usually) two variables as a set of points along a horizontal and vertical axis.
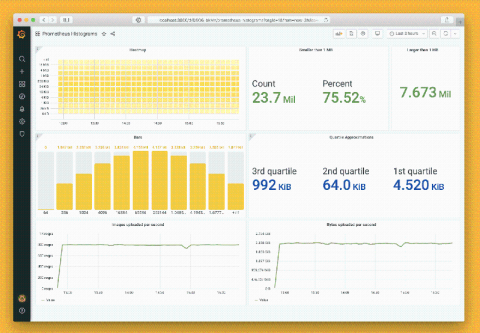
How to visualize Prometheus histograms in Grafana
Do you have a Prometheus histogram and have you asked yourself how to visualize that histogram in Grafana? You’re not alone. Here, we will show you how it’s done. This post assumes you already have a basic understanding of Prometheus and Grafana and it will look at Prometheus histograms from the perspective of Grafana 7.0.
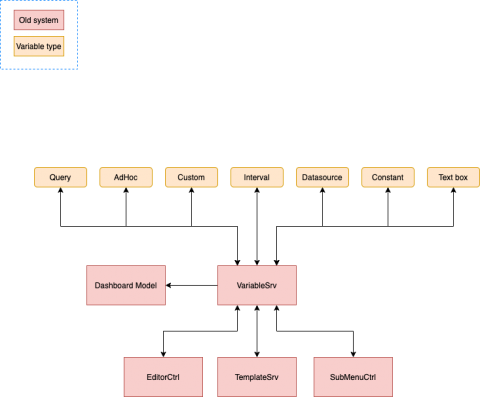
Migrating Grafana's template variables from AngularJS to React: A tale of failures and wins
As many of you already know, we created Grafana using AngularJS, but we have been migrating to React for about two years now. One of the big missing pieces in our migration puzzle was the templating system. This post starts in late 2019 when I first got my hands on this mysterious and complex area of the Grafana code base.
Aggregating and Visualizing Data with Kusto
Got the basics down and ready to move on to more advanced aspects of Kusto? You’ve come to the right place! Here you will learn how to use aggregation functions, visualize query results and put your data into context. If you’re just getting started with Kusto, check out our ‘Jumpstart Guide to Kusto’ before starting on this one. Let’s get into it!
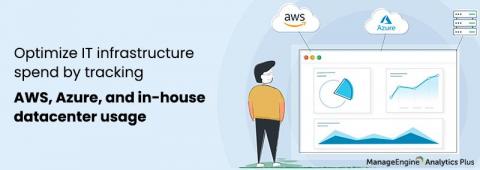
Infrastructure dashboards: Declutter your monitoring data and ensure you're not overspending
The task of monitoring and managing an entire network, including all the servers and applications that run on it, is by no means easy. With so many components of varying complexity, the volume of performance data coming at you can be overwhelming. This information overload increases the chances of missing data that could help discover performance inefficiencies.
Grafana vs Chronograf - The Dashboards
Visualization and Analytics are two of the most important aspects of monitoring without which the entire data stack could just mean NOTHING. Considering the plethora of graphing tools available in the market today, selecting the right one could often be confusing. In our blogs at Metricfire, we break down the best tools in terms of their setup efforts, usage, market competitors, pricing models, best practices, and many more. Grafana and Chronograf both are among the best tools available today.
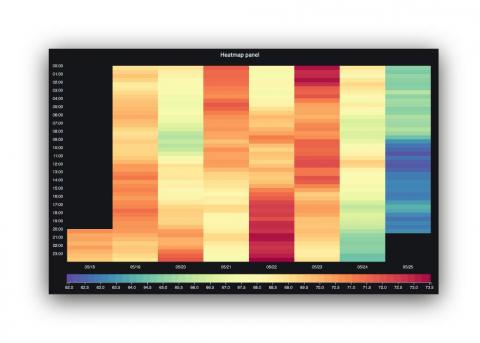
Plugin showcase: The hourly heatmap panel, built on Grafana's new plugin platform
Since Petr Slavotinek created the Carpet plot plugin in 2017, it’s been one of the most popular community plugins for Grafana. Unfortunately, even though the Carpet plot plugin continues to be useful to many users, it’s no longer being maintained. Grafana 7.0 introduced a brand new React-based platform, along with a set of improved APIs for building plugins.
A Major Overhaul of AppSignal Dashboards: Powerful and Easy to Use
We’ve deployed a major overhaul of how you create dashboards and graphs in AppSignal. Using dashboards is now way easier and smoother, and we’re a bit too excited about this. 🚀


