Operations | Monitoring | ITSM | DevOps | Cloud

Dashboards

New Enterprise features in Grafana 7.0: Usage insights and user presence indicator

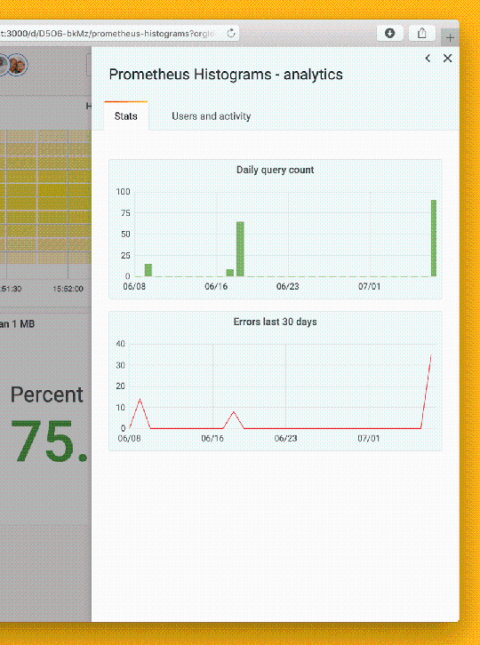
Dashboard sprawl is a real problem whether you’re using Grafana or any other tool. When growing to thousands of users – and as many dashboards – you’ll eventually want more information about how the tool is being used in your organization. After all, dashboards don’t help anyone if they aren’t being used. Managing large installations is one of the areas where Grafana Enterprise improves Grafana, and our launch of usage insights in 7.0 is a key part of that.

Getting started with the Grafana Cloud Agent, a remote_write-focused Prometheus agent

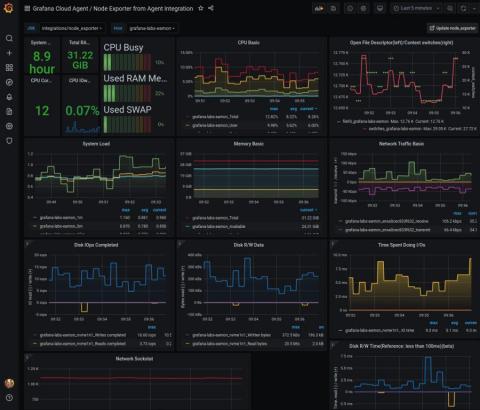
Hi folks! Éamon here. I’m a recent-ish addition to the Solutions Engineering team and just getting my feet wet on the blogging side so bear with me. :) Back in March, we introduced the Grafana Cloud Agent, a remote_write-focused Prometheus agent. The Grafana Cloud Agent is a subset of Prometheus without any querying or local storage, using the same service discovery, relabeling, WAL, and remote_write code found in Prometheus.

Why optimizing for MTTR over MTBF is better for business

The classic debate when running a software as a service (SaaS) business is between release frequency vs. stability and availability. In other words, are you Team MTTR (mean time to recovery) or Team MTBF (mean time between failure)? In this blog post, I argue for MTTR, which encourages you to push more frequently, embrace the instability this may introduce, and invest in training and tooling to deal with the pursuing outages.

Kibana platform migration: Lessons in large scale cross-team collaboration

When Kibana 4.0 was created back in 2015, it only had three apps: Dashboard, Visualize, and Discover. Fast forward five years, Kibana now consists of 100+ plugins, millions of lines of code, thousands of dependencies, and dozens of frameworks. The architecture of Kibana that worked well with three apps had become a bottleneck that was hindering Kibana’s stability, scalability, performance, and development velocity.

Getting Started with Grafana Webinar

In this webinar, Marcus will show you how to get started using Grafana. He’ll walk you through the Grafana user interface while showing how to set up monitoring for a web service that uses Prometheus and Loki to store metrics and logs. You’ll learn how to connect, explore, and correlate data in Grafana to gain valuable insights into your application. This webinar requires no previous experience with Grafana.

How to use Kibana effectively. Today: Detect possible frauds in your data

Kibana is quite powerful and versatile for visualizing data in Elasticsearch. The Elastic Stack can be used for a variety of use cases. One is the detection of frauds e.g. in Banking transaction like within Softbank Payment Service or bonus point accounts like within Miles and More. Other areas are insurance or tax return data.

Introduction to Kibana Best Practices for Log Search and Visualizations

Kibana is a powerful and flexible tool to search and visualize your logs in Elasticsearch – but only if you know how to use it! Zach Hamilton, a Sales Engineer at Logz.io, has enabled hundreds to be successful with Kibana and will provide his insights for best practices in this webinar. Understanding Kibana’s strengths and quirks can help you more efficiently explore your log data so you can quickly understand what’s happening in your environment.

Monitoring Java applications with the Prometheus JMX exporter and Grafana

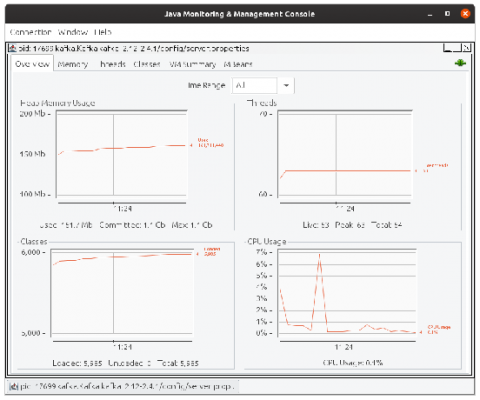
We all know that Prometheus is a popular system for collecting and querying metrics, especially in the cloud native world of Kubernetes and ephemeral instances. But people forget that Java has been running enterprise software since 1995, while Prometheus is a relative newcomer to the scene. It was only created in 2012! Even though Java has had its own metric collectors since before Prometheus was born, none of our new environments speak its (metric) language. How can you bridge that gap?