Operations | Monitoring | ITSM | DevOps | Cloud

Dashboards

How the Cortex and Thanos projects collaborate to make scaling Prometheus better for all

Cortex and Thanos are two brilliant solutions to scale out Prometheus, and many companies are now running them in production at scale. These two projects, both in the CNCF Sandbox, initially started with different technical approaches and philosophies: Cortex has been designed for scalability and high performances since day zero, while Thanos was originally focused on operational simplicity and cost-effectiveness.

How to Build Grafana Dashboards with InfluxDB, Flux and InfluxQL

We’re excited about today’s release of Grafana 7.1, which extends Grafana’s built-in InfluxDB datasource to run queries in both the Flux language and InfluxQL. This means it’s super easy to connect Grafana to InfluxDB — whether you use InfluxDB 1.8 or 2.0, Flux or InfluxQL. Because this InfluxDB datasource is built into Grafana 7.1, there is no separate plugin to download and install.

Kibana Settings: Spaces, Export Dashboard, and more

Kibana is considered the “window” to Elasticsearch and indeed it’s a powerful UI for searching, filtering, analyzing, and visualizing Elasticsearch data, but Kibana settings are also used to configure, administer and monitor the Elasticsearch cluster. In this lesson, we’re going to explore how Kibana settings can be tweaked for collaborative teamwork. Without further ado let’s jump right into spaces!

Loki tutorial: How to set up Promtail on AWS EC2 to find and analyze your logs

Amazon’s Elastic Compute Cloud (AWS EC2) is one of the most popular ways to run applications in the cloud, but finding logs for a given instance is a common struggle. That’s where Loki can help. With Loki aggregation, you can group all your logs from all your virtual machines in one place, and with its search capabilities, you can quickly find and analyze them. It’s a great way to gain visibility in your cloud deployment.

Dashboards Beta v0.6: O.M.G. Oh My Grid (Layout)

If you’re new to the Dashboards Beta app on Splunkbase and you’re trying to get started with building beautiful dashboards, the "Dashboards Beta" blog series is a great place to start. This Dashboards Beta app brings a new dashboard framework, intended to combine the best of Simple XML and Glass Tables, and provide a friendlier experience for creating and editing dashboards.

What's New in Logz.io with Infrastructure Monitoring? Upgrading to Open Source Grafana 7

Logz.io Infrastructure Monitoring just got some substantive upgrades to kick off the summer. The major change is the Grafana 7 update, specifically to version 7.0.3. This includes several new features. The Logz.io deployment will also include applying Grafana to logs. The Transform tab gives users the option to quickly add non-time series data to tables and then pair it with other data (time series or not) in your Metrics deployment.

Where did all my spans go? A guide to diagnosing dropped spans in Jaeger distributed tracing

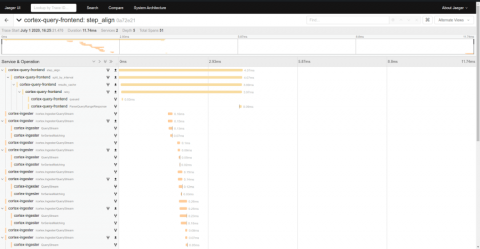
Nothing is more frustrating than feeling like you’ve finally found the perfect trace only to see that you’re missing critical spans. In fact, a common question for new users and operators of Jaeger, the popular distributed tracing system, is: “Where did all my spans go?” In this post we’ll discuss how to diagnose and correct lost spans in each element of the Jaeger span ingestion pipeline.

Grafana and NGINX are partnering to give the open source community a turnkey experience for visibility

Over the past few years, NGINX users have naturally gravitated toward Grafana, and vice versa. These days, it’s not uncommon to see these two open source tools used together in the wild. And for good reason. F5, which acquired NGINX last year, is prioritizing building visibility across the entire product set, to make it easy for customers to quickly gain the insights that they need. Meanwhile, Grafana has evolved into the primary visualization and analysis tool in the open source market.

Grafana Loki sneak peek: Generate Ad-hoc metrics from your NGINX Logs

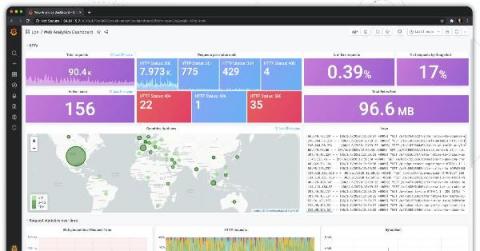
Get a sneak preview of a future version of Grafana Loki that enables you to generate ad-hoc metrics from your log data. This video features a Loki-based web analytics dashboard, which uses the access logs of the popular open-source web server NGINX. Every panel on this dashboard uses ad-hoc metrics created with Loki, well, besides the Log panel obviously. Would this be useful for your use-case? Let us know in the comments.

New Enterprise features in Grafana 7.0: Usage insights and user presence indicator

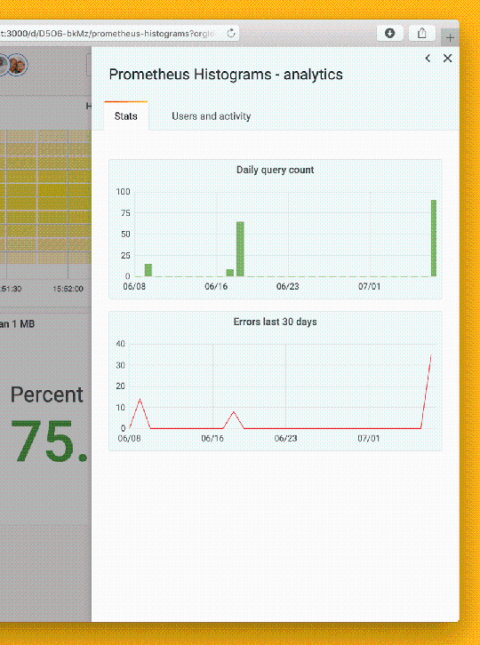
Dashboard sprawl is a real problem whether you’re using Grafana or any other tool. When growing to thousands of users – and as many dashboards – you’ll eventually want more information about how the tool is being used in your organization. After all, dashboards don’t help anyone if they aren’t being used. Managing large installations is one of the areas where Grafana Enterprise improves Grafana, and our launch of usage insights in 7.0 is a key part of that.