Operations | Monitoring | ITSM | DevOps | Cloud

Dashboards

3 tips to improve your Grafana dashboard design

Every Grafana user is a dashboard designer. The Grafana community gladly shares their dashboards, so there’s tons of inspiration available. Chances are you’ve downloaded some community dashboards and tweaked them in search of patterns that work for you. But if you haven’t found them, you’re not alone! In my Aug. 27 webinar, “A beginner’s guide to dashboard design,” I’ll cover the basics of good dashboard design.

[KubeCon + CloudNativeCon EU recap] Better histograms for Prometheus

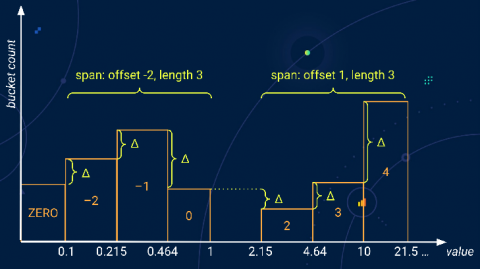
It’s only four months ago that I blogged about histograms in Prometheus. Back then, I teased my talk planned for (virtual) KubeCon Europe 2020. On Aug. 20, the talk finally happened. It completed the trilogy of histogram talks also mentioned in my previous blog post. Here is the recommended viewing order.

Cortex, the scalable Prometheus project, has advanced to incubation within CNCF

I’m pleased to report that today, the Cortex project advanced from sandbox to incubation within the Cloud Native Computing Foundation after a vote from CNCF’s Technical Oversight Committee (TOC). The TOC’s decision is a signal that Cortex has stepped up in maturity, attracting not just innovators but also early adopters among enterprises. To achieve incubation, CNCF projects undergo due diligence and have to demonstrate a healthy level of adoption and community activity.

Kibana Hidden Features - get the most out of your data by using Kibana like a pro - Aug 20, 2020

Kibana is quite powerful and versatile for visualizing data in Elasticsearch. And when you have a flexible tool like that, it's hard to know (and keep up with) everything that it can do. Just look at all of the things that MacGyver can do with a Swiss Army knife. In this talk, Felix will demo many of his favorite Kibana features — some new and some hidden gems — that let him make the most of his data.

[KubeCon + CloudNativeCon EU recap] Getting some Thanos into Cortex while scaling Prometheus

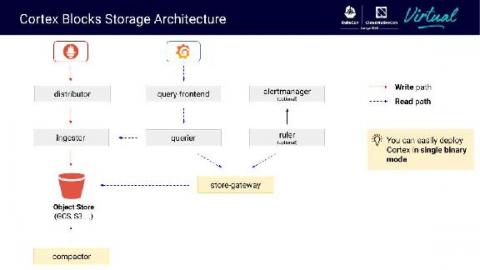
Yesterday at KubeCon + CloudNativeCon EU, Grafana Labs software engineer Marco Pracucci, a Cortex and Thanos maintainer, teamed up with Thor Hansen, a software engineer at Hashicorp, to give a presentation called “Scaling Prometheus: How we got some Thanos into Cortex.” In their talk, the pair discussed a new storage engine they have built into Cortex, how it can reduce the Cortex operational cost without compromising scalability and performance, and lessons learned from running Cortex at s

Visualize performance trends over time with the latest graph for RUM

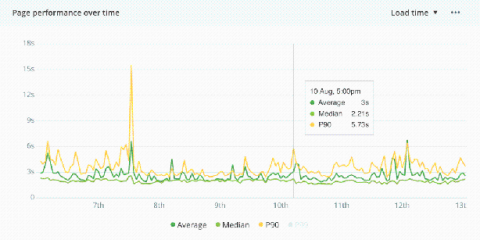
Monitoring trends in application performance helps you identify poor performance and visualize the impact of performance optimizations you’ve made. To help you better monitor performance trends, we’ve released a new line graph now available across all performance details pages in Real User Monitoring.

Introducing the Grafana Accelerator Program, one of the investments we're making in the community after raising $50 million

This morning, we announced that we raised $50 million in Series B funding. This additional funding, following our $24 million round last October, will enable us to dramatically accelerate research and development at Grafana Labs. We plan to hire more engineers and focus on product innovation. And importantly, it will help us continue to nurture and grow our community of millions of developers around the world.

In-house vs. MetricFire

You’re ingesting 20,000 data points a second, in 400,000 metrics, from thousands of AWS instances – and your monitoring can’t handle the load. You need a scalable, highly-available monitoring and dashboarding solution (and you need it yesterday). Should you do it yourself with an in-house Graphite or Prometheus monitoring system? Or will you skip the headache and choose a hosted service like MetricFire?

10 Helm Tutorials to Start your Kubernetes Journey

The growth of Kubernetes has been stellar and K8s applications have grown in importance and complexity. Today, even configuring a single application can require creating many interdependent K8s sources that each depend on writing a detailed YAML manifest file. With this in mind, Helm as a package manager for Kubernetes is a major way users can make their K8s configurations reusable.

Scaling Prometheus: How we're pushing Cortex blocks storage to its limit and beyond

In a recent blog post, I wrote about the work we’ve done over the past year on Cortex blocks storage. Cortex is a long-term distributed storage for Prometheus. It provides horizontal scalability, high availability, multi-tenancy and blazing fast query performances when querying high cardinality series or large time ranges.