Operations | Monitoring | ITSM | DevOps | Cloud

Dashboards

Storing, Processing and Visualizing Data with the ogamma Visual Logger for OPC and InfluxDB

This article describes an end-to-end solution built with open source components InfluxDB and Grafana and the ogamma Visual Logger for OPC, to collect industrial process control data, analyze it in streaming mode, and visualize it in a dashboard.

New features in the ServiceNow plugin for Grafana: table query, annotations, and more!

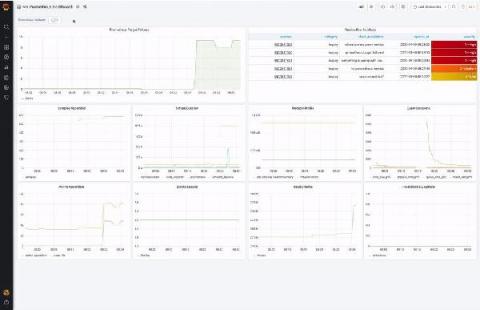
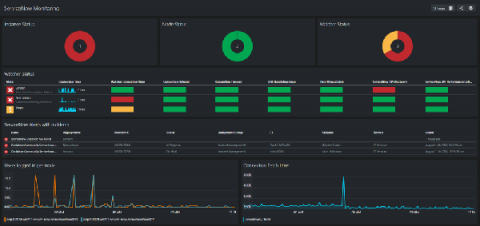
Greetings! This is Eldin reporting from the Solutions Engineering team at Grafana Labs. In previous posts, you might have read about announcing ObservabilityCON or our release of Grafana 7.2. In this week’s post, I am introducing Dave Frankel, who will be covering our updated ServiceNow plugin. – Eldin In a previous post we announced the release of our Enterprise ServiceNow plugin. Our first release was focused around incident and change management based on the feedback we received.

Kibana Lens Tutorial: Easily Create Stunning Visualizations

Millions of people already use Kibana for a wide range of purposes, but it was still a challenge for the average business user to quickly learn. Visualizations often require quite a bit of experimentation and several iterations to get the results “just right” and this Kibana Lens tutorial will get you started quickly.

Now you can add Amazon Timestream to your Grafana observability dashboard

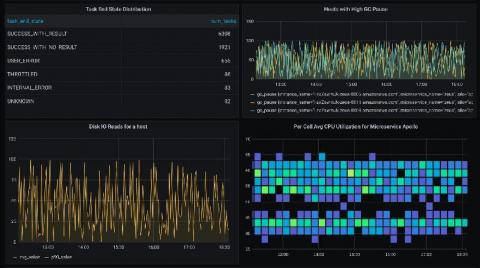
Today, AWS launched Amazon Timestream, a fast, scalable, serverless time series database purpose-built for IoT use cases. If you’re looking into trying out Timestream, know that you can visualize the native Timestream queries with Grafana out of the box. Here are some examples of the robust, SQL-style Timestream queries visualized in Grafana.

New in Grafana 7.2: $__rate_interval for Prometheus rate queries that just work

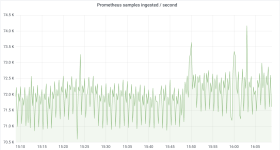
What range should I use with rate()? That’s not only the title of a true classic among the many useful Robust Perception blog posts; it’s also one of the most frequently asked questions when it comes to PromQL, the Prometheus query language. I made it the main topic of my talk at GrafanaCONline 2020, which I invite you to watch if you haven’t already. Let’s break the good news first: Grafana 7.2, released only last Wednesday, introduced a new variable called $__rate_interval.

How I'm using Grafana and Prometheus to monitor my 3D printing

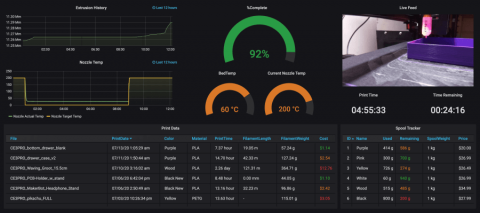
My name is Jonathan Stines, and I am a Penetration Tester for Rapid7, a cybersecurity company located in Austin, Texas. A small handful of my former colleagues at Rapid7 now work at Grafana Labs and have said it was a pretty cool spot to have landed. I had a vague understanding of what Grafana was, but what really struck my interest was when I saw their sweet dashboards in the HBO series Silicon Valley.

Putting anomalies into context with custom URLs in Kibana

Machine learning in the Elastic Stack provides you with an intuitive way to detect anomalies in vast data sets. But even the most sophisticated anomaly detection job might not reveal the root cause of anomalous behavior. After an anomaly is detected, you may need to dive into further analysis, review multiple corresponding metrics, and investigate how they relate to the anomalous spike.

How we use the Grafana GitHub plugin to track outstanding pull requests

First of all, we’re pleased to announce the first release of the GitHub data source. The source code is available at github.com/grafana/github-datasource. Contributions, feature requests, and bug reports are welcome. Using the GitHub data source, Grafana users can visualize data from GitHub’s API. In this blog, we’ll go over some use cases for this handy plugin.