Operations | Monitoring | ITSM | DevOps | Cloud

Dashboards

ObservabilityCON Day 1 recap: Loki 2.0 and Grafana Tempo announced, real-time observability with Redis, Grafana demos, a tester's perspective, and more

ObservabilityCON 2020 is live! Over the next few days, Grafana Labs is bringing together the Grafana community for talks dedicated to observability. Day 1 was filled with several new announcements about exciting projects and feature enhancements we’ve been working on for our customers and community. And there will be a lot more to learn about this week, like the session on Loki 2.0 on Wednesday.

Announcing Grafana Tempo, a massively scalable distributed tracing system

Grafana Labs is proud to announce an easy-to-operate, high-scale, and cost-effective distributed tracing system: Tempo. Tempo is designed to be a robust trace id lookup store whose only dependency is object storage (GCS/S3). Join us in the Grafana Slack #tempo channel or the tempo-users google group to get involved today!

Handle Unruly Outliers with Log Scale Heatmaps

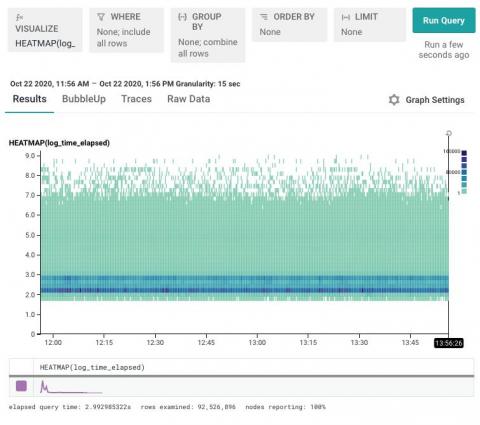
We often say that Honeycomb helps you find a needle in your haystack. But how exactly is that done? This post walks you through when and how to visualize your data with heatmaps, creating a log scale to surface data you might otherwise miss, and using BubbleUp to quickly discover the patterns behind why certain data points are different.

Communicate with Service Status Messaging

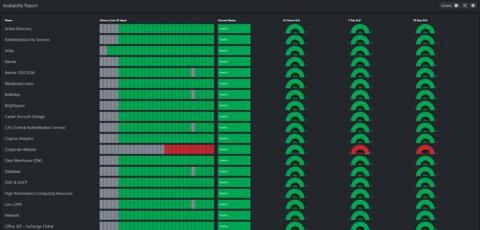
Sometimes an organization gets bogged down with the details. It happens. You have all of this fantastic data in SCOM, and you’re trying to share it, but your users don’t care. That’s not true. They care, but what they don’t care about is the server. To put it another way, they care if the service or application they depend on is working. But here’s the catch, you can’t do this in SCOM.

Introducing the Snowflake Enterprise plugin for Grafana

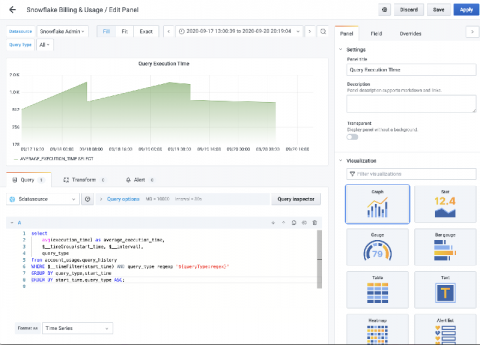
Snowflake offers a cloud-based data storage and analytics service, generally termed “data warehouse-as-a-service.” The main benefit of Snowflake is that you pay for compute and storage that you “actually use,” so it’s not “just another database.” Snowflake has become very popular over the last few years, culminating in a huge IPO just a couple of weeks ago, by allowing enterprise users to affordably store and analyze data using cloud-based hardware and software

Share application status with the Business

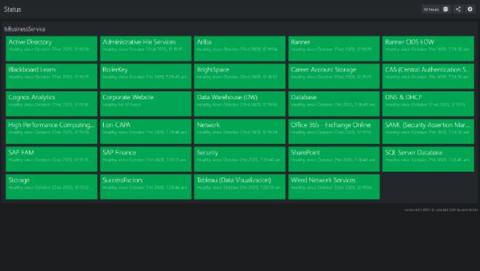
Once your monitoring is operational for a while, it becomes evident that infrastructure monitoring alone is not enough. Sure, SCOM is excellent when focused on an infrastructure level problem. Do you have an alert that your Windows server is running out of space? Check. Can you check to see if your SQL Server has had a lot of deadlocking recently? Check. Do you know if your Linux server is out of swap space? Can you report on how fast it has been running out? Check.

Quick tip: How Prometheus can make visualizing noisy data easier

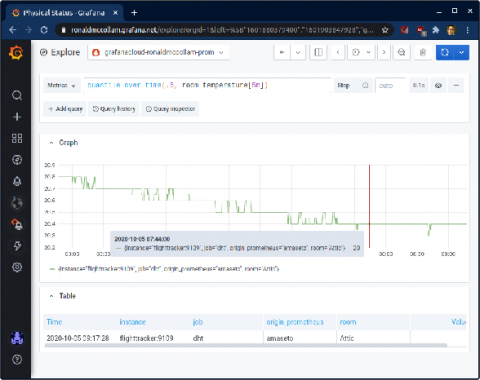
Most of us have learned the hard way that it’s usually cheaper to fix something before it breaks and needs an expensive emergency repair. Because of that, I like to keep track of what’s happening in my house so I know as early as possible if something is wrong. As part of that effort, I have a temperature sensor in my attic attached to a Raspberry Pi, which Prometheus scrapes every 15 seconds so I can view the data in Grafana.

How to switch Cortex from chunks to blocks storage (and why you won't look back)

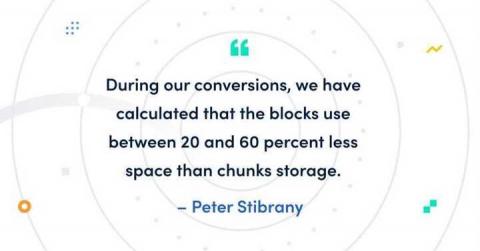
If you’ve been following the blog updates on the development of Cortex – the long-term distributed storage for Prometheus – you surely noticed the recent release of Cortex 1.4, which focuses on making support for “blocks engine” production-ready. Marco Pracucci has already written about the blocks support in Cortex, how it reduces operational complexity for running Prometheus at massive scale, and why Grafana Labs has invested in all of that work.