Operations | Monitoring | ITSM | DevOps | Cloud
Dashboards
The 7 cultural values that drive Grafana Labs
At Grafana Labs, we believe that our culture is one of the differentiators that make us an extraordinary company. In the middle of a pandemic, we’ve been in the very fortunate position to be in a high-growth phase: We’ve expanded the team by 118% this year, and our headcount just tipped over 250 global Grafanistas.
How to find traces in Tempo with Elasticsearch and Grafana
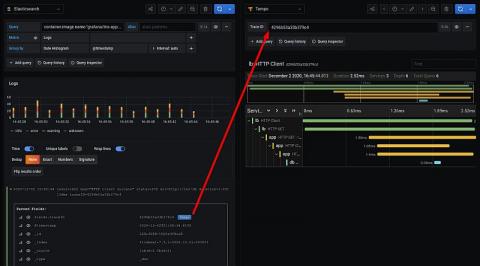
Grafana Tempo, the recently announced distributed tracing backend, relies on integrations with other data sources for trace discovery. Tempo’s job is to store massive amounts of traces, place them in object storage, and retrieve them by ID. Logs and other data sources allow users to quickly and more powerfully jump directly to traces than ever before. Previously we investigated discovering traces with Loki and exemplars.
Control access with Teams Folders
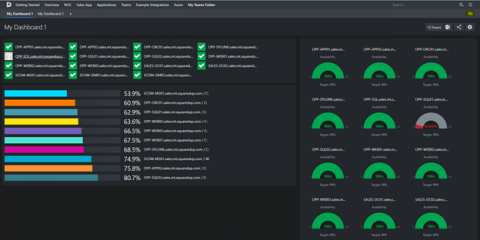
If you work in monitoring, you know how important it is for the right people to see the right data. Too much irrelevant data creates a flurry of alerts that hinders productivity, and missing out on key data leads to visibility issues. Worst of all is when you get the wrong people tinkering with data that belongs to other teams.
Bigger is Better with Splunk TV: Highlights of .conf20
Last year at .conf19, we announced the GA release of Splunk TV, our free app for Apple TV that provides users with a secure, reliable, read-only platform to display Splunk dashboards on their TVs. Splunk TV was built with security in mind, to power your SOCs and NOCs. Using Splunk TV instead of running dedicated computers to power each screen saves money and increases security. The read-only experience eliminates the risk of someone with physical access tampering with your environment.
Kibana Canvas: An In-Depth Guide
When we look at information, numbers, percentages, statistics, we tend to have an easier time understanding and interpreting them if they’re also represented by corresponding visual cues. Kibana Canvas is a tool that helps us present our Elasticsearch data with infographic-like dashboards – fully visual, dynamic, and live.
Get the full picture with SquaredUp's ServiceNow Tile (Part 2)
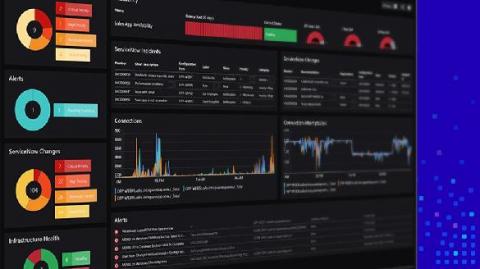
As a systems admin, chances are you’ve got a whole host of monitoring tools and data sources to keep track of: ServiceNow, SCOM, Splunk, Solarwinds, plus your APM and CI/CD tools too. With SquaredUp, you can get a single pane of glass, surfacing your ServiceNow ITSM data alongside data from these other techstacks too! For an introduction on how to get the full picture of your ServiceNow data, head over to Part 1 of our ServiceNow Tile blog series.
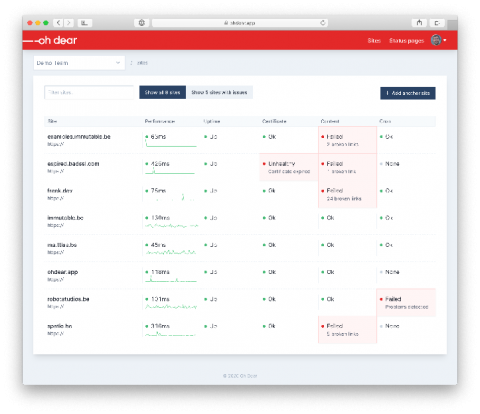
A fresh new dashboard look!
We just launched our brand new monitoring dashboard to all clients, giving a modern new look & feel to Oh Dear! There are plenty of improvements under the hood, so let's dive right in.
How we eliminated service outages from 'certificate expired' by setting up alerts with Grafana and Prometheus
Here at Grafana Labs we are lucky to work with many partners around the globe. From these partnerships, we get great inspiration into some clever use cases on how Grafana and Prometheus can be used to great effect for service monitoring and availability. We came across this use case that our partner OpenAdvice came up with for their client base, and we thought it was too good to keep secret!
What is a single pane of glass?
There’s a new Azure agent in town – Azure Monitor Agent (AMA). I hear you saying, “Wait, aren’t there already enough Azure agents? So why another new agent?” A very valid question! Indeed, there are already a few Azure monitoring agents: the Log Analytics Agent, the Diagnostic Extension agent, and the Telegraf agent (and also the Dependency agent if you want to count it separately).


