Operations | Monitoring | ITSM | DevOps | Cloud

Mezmo

Tucker Callaway on the State of the Observability Market

Tucker Callaway is the CEO of LogDNA. He has more than 20 years of experience in enterprise software with an emphasis on developer and DevOps tools. Tucker drives innovation, experimentation, and a culture of collaboration at LogDNA, three ingredients that are essential for the type of growth that we've experienced over the last few years.

5 Examples of Metrics or Log Data That Drives Observability

Which data sources do DevOps teams need in order to achieve observability? At a high level, that’s an easy question to answer. Concepts like the “three pillars of observability”—logs, metrics, and traces—may come to mind. Or, you may think in terms of techniques like the RED Method or Google’s Golden Signals, which are other popular frameworks for defining which types of data teams should collect for monitoring and observability purposes.

Announcing the Control API Suite

As LogDNA has grown, many of our customers have too, meaning that they are bringing in more ingestion data sources and expanding their use cases for their logs. To help with managing more data, we’re excited to introduce the Control API suite. We’ve built 4 individual APIs that will help companies programmatically configure their data and how they want to ingest logs. Below, we’ll cover each new API in detail as well as why they are massively impactful for our customers.‍

Announcing Early Access to Variable Retention on LogDNA

The massive proliferation of log data forces teams to manage the costs to process, route, and store it. Teams need access to this data to gain critical insights into their services, but for many organizations this presents a challenge for their budget. Logging can get expensive, fast, which often results in teams making difficult tradeoffs between aggregating enough logging information to be useful and controlling the cost of storing all those logs.

Apache Kafka Tutorial: Use Cases and Challenges of Logging at Scale

Enterprises often have several servers, firewalls, databases, mobile devices, API endpoints, and other infrastructure that powers their IT. Because of this, organizations must provide resources to manage logged events across the environment. Logging is a factor in detecting and blocking cyber-attacks, and organizations use log data for auditing during an investigation after an incident. Brokers, such as Apache Kafka, will ingest logging data in real-time, process, store, and route data.

Why LogDNA Received the EMA Top 3 Award for Observability Platforms

We’re honored to be included in Enterprise Management Associates’ EMA Top 3 Award for Observability Platforms. This award recognizes software products that help enterprises reach their digital transformation goals by optimizing product quality, time to market, cost, and ability to innovate—all the things we’re passionate about at LogDNA.

Taming Rails Logging with Lograge and LogDNA

Rails is a classic on Ruby for a reason. The framework is powerful, intuitive and the language has a low entry bar. However, being designed when systems existed on a single server, standard Rails logging is excessively fractionalized. Even on a single server, a straightforward call can quickly turn into seven unique, unconnected logs.

Automate your LogDNA + PagerDuty Incident Workflow

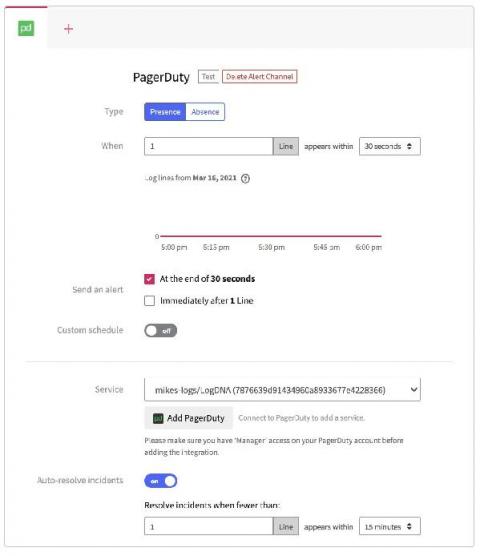
LogDNA integrates with your PagerDuty instance to help trigger incidents based on log data coming in from your ingestion sources. This allows your teams to quickly understand when there are issues with your application, and where in the logs you can investigate to understand root cause. To help further accelerate your team’s ability to understand the state of your applications, we are introducing the ability to automatically resolve those PagerDuty Incidents directly from LogDNA.

How LogDNA Gives Developers Easy Access To The Information They Need

Developers of any skill set find it frustrating when we don’t have access to the information we need. We want easy and complete access to application logs so that we can troubleshoot application problems. Quickly resolving issues requires a complete picture of what’s going on. Using the wrong tools limits our ability to determine what’s wrong, slowing the repair process.