Operations | Monitoring | ITSM | DevOps | Cloud

Mezmo

7 Ways to Make Your Logs More Actionable

Generating and collecting logs is one thing. Generating and collecting actionable logs can be quite another. That's a problem because logs that are not actionable – meaning they can be easily used to derive valuable insights or resolve issues – are not very valuable. If you don't generate actionable logs, you might as well not log at all. Fortunately, ensuring that you generate useful logs is not tricky. Keep reading for seven tips on making your logs actionable and valuable.

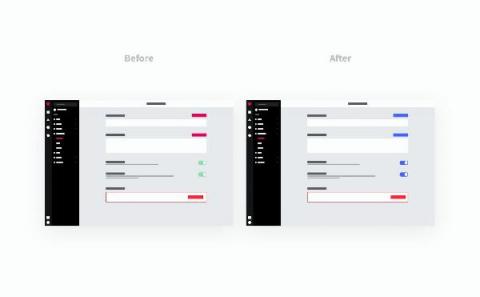
Making the LogDNA UI more accessible

I’m Tim, a Product Design Manager at LogDNA and a massive coffee and magic enthusiast. My team is responsible for creating a beautiful and easy-to-navigate user interface so that you can easily access, and gain value from, your logs. We’ve been working on making our product more accessible and are about to roll out some subtle changes.

Announcing the GA of the LogDNA Configuration API and LogDNA Terraform Provider

We’re excited to announce that our Configuration API and Terraform Provider are now generally available for all LogDNA customers. We received tremendous feedback from our public beta release and, based on that feedback, we are enabling several new features with the GA release that allow for more programmatic workflows with LogDNA. First, we are enabling Preset Alerts as a new resource that can be configured with the configuration API as well as within Terraform.

The Benefits of Centralized Log Management and Analysis

Log centralization is kind of like brushing your teeth: everyone tells you to do it. But until you step back and think about it, you might not appreciate why doing it is so important. If you’ve ever wondered why, exactly, teams benefit from centralized logging and analysis, keep reading. This article walks through five key advantages of log centralization for IT teams and the businesses they support.

How to Reduce Alert Fatigue: Preventing Noisy Alerts and Error Messages

Monitoring solutions are a vital component in managing an application’s environment. From the systems layer all the way up to the end user’s connection to the app, you want to find out how the platform is performing. Indicators like CPU, memory, the number of connections, and overall health help teams make informed decisions for guaranteeing uptime. Teams monitor metrics (short-term information) and logs (long-term information) mainly from a reactive perspective.

How to Notify Your Team of Errors: Email vs. Slack vs. PagerDuty

Site Reliability Engineering (SRE) and Operations (Ops) teams heavily rely on notifications. We use them to know what’s going on with application workloads and how applications are performing. Notifications are critical to ensuring SREs and Ops teams can resolve errors and reduce downtime. They’re also crucial when monitoring environments — not only when running in production but also during the dev-test or staging phase.

Accelerating Dev Workflows: Terminal-driven Debugging

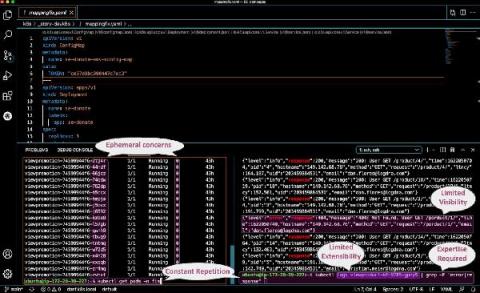
The pursuit of Digital Transformation and DevOps practices has led to several benefits such as increased deployment rates and better collaboration across teams. However, it has also led to endless abstraction, an increase in responsibilities, and many new tools (Kubernetes, hybrid-clouds and all their services, etc.). This increase in complexity has turned observability into an essential component of all ecosystems.