Operations | Monitoring | ITSM | DevOps | Cloud
%term
Scout
Using AI analytics to detect real-time application issues
timeShift(GrafanaBuzz, 1w) Issue 47
We cover a lot of ground this week with posts on general monitoring principles, home automation, how CERN uses open source projects in their particle acceleration work, and more.
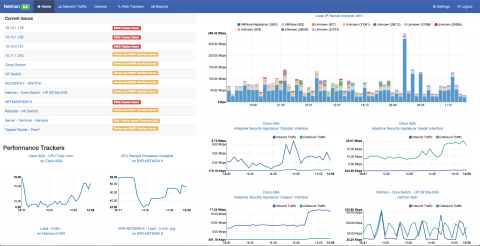
Remove Manual IT Troubleshooting with Real Time Traffic Analysis
It does not matter how BIG your IT team is – this little device doesn’t need much. No fancy desks, gadgets, vacation days or sick days. It keeps your team working efficiently and effectively so that they can focus on the real matters!
5 Critical Reasons for Network Traffic Analysis
As communication and network infrastructure grows in size and complexity, having a complete view and understanding of your network environment (including the amount and type of network traffic going back and forth) becomes vital to your business’ health and operations. Having the right tools to do the job is just as important. If you can’t quickly determine the source, destination, rate and the type of traffic going across the network, you don’t have the right tool.
3 Ways to Reduce Alert Noise and Fatigue in OpsGenie
RancherVM Live Migration with Shared Storage -- Demonstration
Rollbar
Monitoring with Azure and Grafana
What is whitebox monitoring? Why do we monitor our systems? What is the Azure Monitor plugin and how can I use it to monitor my Azure resources? Recently, I spoke at Swetugg 2018, a .NET conference held in Stockholm, Sweden to answer these questions. In this video you’ll learn some basic monitoring principles, some of the tools we use to monitor our systems, and get an inside look at the new Azure Monitor plugin for Grafana.


