Dive into efficient development with Git Integration for Jira! Join our Workshop this Thursday, 6/27 to explore how Jira issue keys, smart commits, and automation rules can enhance your development workflow.
Iin the world of Kubernetes and increasingly ephemeral environments. APMs, despite their benefits, simply were not designed with today’s microservices and complex cloud architectures in mind. This is why so many APM users are looking for a new observability-driven approach.
Explore the innovative features of Logz.io’s Open 360 observability platform. Discover how AI-driven insights can transform your observability and apm process, improve efficiency, and enhance decision-making. Learn from our experts as they demonstrate Logz.io Open 360 capabilities, including real-time monitoring, anomaly detection, and more. See how to unlock the full potential of your data with cutting-edge AI technology.
Monitoring a Kubernetes environment brings a number of complex challenges. Learn how you can overcome these challenges while also closely managing costs to help you efficiently and effectively scale your Kubernetes environment.
With Anomaly Detection for App 360, Open 360 users can now enlist targeted automation to do more of the work for them — automatically monitoring and alerting any issues occurring within the specific services and microservices they identify as being most critical, which are often those that immediately impact business or SLO-related requirements.
Gone are the days when incidents were manual to resolve, invisible to customers, and overall viewed with a negative lens. This is part two of the virtual event series as we dive into our fresh take on what incidents should look like, The Incident Way, and hear from customer stories putting these principles into practice.
Lumigo is an observability and troubleshooting platform that autonomously deploys Observability in under 5 minutes with a single click, automatically capturing and contextualizing all of the metrics, logs, and distributed traces developers need to troubleshoot microservice issues in production. Lumigo is the only observability platform that enriches traces with complete in-context request and response payloads and correlates them to the relevant logs and metrics, enabling developers to resolve issues up to 80% faster.
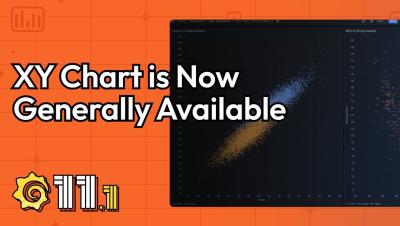
We’re excited to announce that the XY chart is generally available in Grafana 11.1! XY charts provide a way to visualize arbitrary x and y values in a graph so that you can easily show the relationship between two variables. Say hello to scatter plots and bubble charts.
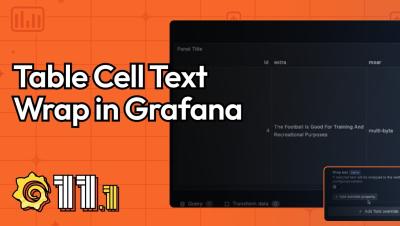
This highly requested feature is now available in preview! You can now wrap text in table cells. By default, the column with the longest text is selected for wrapping. You can also configure wrapping manually using field overrides.
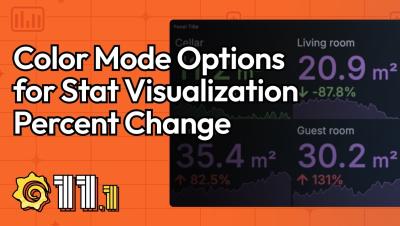
We’ve introduced options to change the color mode for stat visualization percent changes. Want your positives to show up as red and negatives to show up as green? With this feature, now it’s possible.