Operations | Monitoring | ITSM | DevOps | Cloud
%term
Q4 up 33% and 2018 up 30%
We’ve wrapped up the fourth quarter and 2018 on a high note! We’ve completed the fourth quarter of 2018 with a 33% increase over the fourth quarter of 2017, and the year 2018 finished 30% over 2017’s totals.
HomeAway: Maintaining a healthy PaaS with Datadog
Webinar: Office 365 Monitoring with NiCE
Webinar: Office 365 Monitoring with NiCE
Monitoring Microsoft Azure with Logz.io
Microsoft Azure has long proven it’s a force to consider in the world of cloud computing. Over the past year, Azure has made some significant steps in bridging the gap with AWS by offering new services and capabilities as well as competitive pricing.
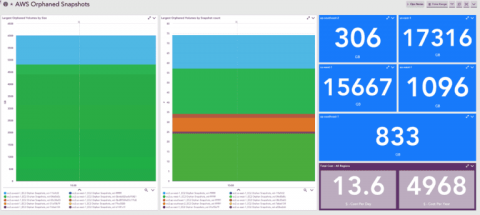
How to Identify Orphaned EBS Snapshots to Optimize AWS Costs
So a while back I got an email from our finance team. I was tasked to assist with tagging resources in our AWS infrastructure and investigate which items are contributing to certain costs. I don’t know about other engineers, but these kinds of tasks are on the same realm of fun as … wiping bird poop off your windshield at a gas station. So I did the sanest thing I could think of.
How to Use Apdex Score to Measure User Satisfaction
Looking for ways to measure your users’ experience? You’ve come to the right place. In this article, we will be diving into several ways to measure your users’ satisfaction as well as ways to enhance & expand your real user monitoring strategy.
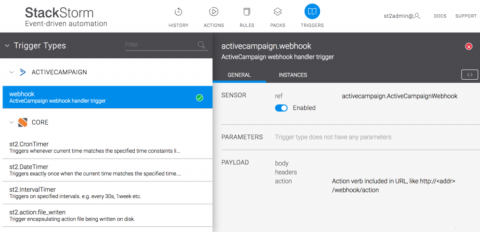
2018 Year in Review & 2019 StackStorm User Survey
2018 is behind us and first of all we would like to thank all of our users, community members and customers for supporting us and making 2018 a successful year. In this post we would like to have a look at the various things we have released and important milestones we have reached in 2018.
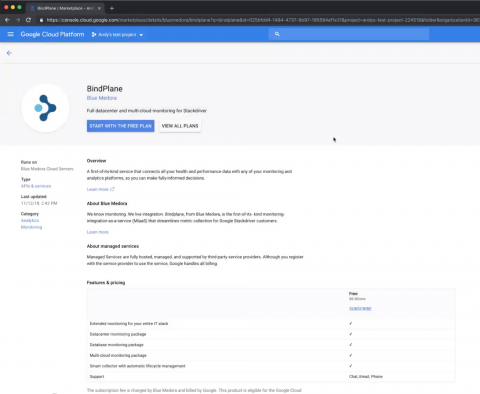
Extending Stackdriver to on-prem with the new BindPlane integration
We introduced our partnership with Blue Medora last year, and explained in a blog post how it extends Stackdriver’s capabilities. We’re pleased to announce that you can now join our new offering for Blue Medora. If you’re using Stackdriver to monitor your Google Cloud Platform (GCP) or Amazon Web Services (AWS) resources, you can now extend your observability to on-prem infrastructure, Microsoft Azure, databases, hardware devices and more.


