Operations | Monitoring | ITSM | DevOps | Cloud

%term

Isolating Bottlenecks: How to Determine If Your Slowdown Is Due to the Database or API

Every slowdown in your application can be traced to specific components like a database or an API, and quickly identifying the source aids the troubleshooting process. But when an API is underperforming, it may be difficult to tell whether the issue is with the API logic itself or an external service like a database that it interacts with before sending responses.

Monitoring Specific Components and Regions in Your Third-Party Services

Chances are, most of your third-party cloud and SaaS dependencies are globally distributed and have many regions of operation. Chances are, your applications use a subset of a cloud or SaaS service. If you are monitoring such a service, why should you receive alerts for all regions or every single component in the service? E.g. if you use Digital Ocean, you might be using Kubernetes in their US locations (NYC and SFO). You would want to know only when there is an outage in one of these locations.

Cost Effective Web Hosting on AWS Graviton

Elevate your knowledge at the second webinar of our Graviton series, "Cost Effective Web Hosting on AWS Graviton." In collaboration between 2bcloud and Amazon Web Services (AWS), this event will provide you with an in-depth, hands-on demonstration on setting up an energy-efficient, cost-optimized web hosting environment using AWS Graviton processors, followed by an expert-led Q&A.

Introduction to K8s Horizontal Pod Autoscaling | Monitor Autoscaling in Splunk Observability Cloud

In this video, I’m going to introduce you to Horizontal Pod Autoscaling in Kubernetes and monitoring autoscaling events in Splunk Observability Cloud. I’ll first walk through our simple application deployment definition. We will analyze the metrics of that application in Splunk Observability cloud, identifying that the application is under resource pressure. I’ll then discuss the scaling options at our disposal, and we will walk through an implementation of a Horizontal Pod Autoscaler that will automatically scale our pods according to the load they are receiving.

Why companies choose Adaptive Metrics and how they save time and (a lot of) money

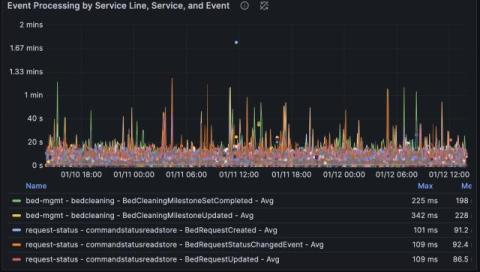
Let’s cut to the chase: Managing metric volumes at scale is hard. In fact, when we asked the open source observability community about their biggest concerns in this year’s Grafana Labs Observability Survey, the top four responses — cost, complexity, cardinality, and signal-to-noise ratio — can all be tied back to exponential growth in telemetry data.

Building an asset attribution system for software security

Asset attribution is an operational necessity for robust digital protection, but hasn't always been easy to achieve. Especially when software state and ownership is unknown, or inconsistent. This blog delves into the historical complexities and challenges of asset attribution for security and engineering teams and explores how Internal Developer Portals like Cortex can help.