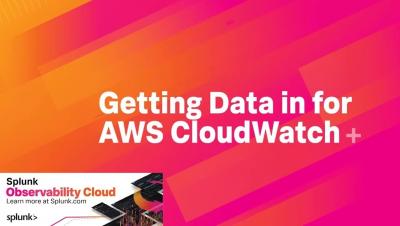
Operations | Monitoring | ITSM | DevOps | Cloud

How to

Understand your services with Cloud Logging

What do you do when you know your service is having an issue? In this episode of Engineering for Reliability, we’ll show how you can use Cloud Logging to ingest, route, store, and view logs from your services and use them to fully understand application issues. Watch to learn how you can find issues faster, make your services more reliable, and keep your users happy.

How to Discover Devices and Connections With Engineer's Toolset

Learn how you can easily discover MAC addresses within your local network and match them to IP addresses with the MAC Address Discovery tool from SolarWinds Engineer's Toolset. SolarWinds® Engineer’s Toolset (ETS) helps you monitor and troubleshoot your network with the most trusted tools in network management. Version 11.0 now comes with an intuitive web console for 5 of the most popular tools - Response Time Monitor, Interface Monitor, CPU Monitor, Memory Monitor, and TraceRoute.

How to use Kibana time shifts, advanced formulas, and dynamic colors

Ad hoc analysis capabilities in Kibana enable you to visualize your time series data easily and intuitively. In this video, learn how to use time shifts, advanced formulas, and dynamic colors in Kibana to examine data over different time periods, author your own metrics to use in visualizations, and highlight important values in tables.

Cloud Key Management in a minute

Cloud Key Management allows you to create, import, and manage cryptographic keys, as well as perform cryptographic operations in a single centralized cloud service. In this episode of Cloud Bytes, we show how you can centrally manage symmetric and asymmetric encryption keys for your cloud services. Watch and learn how you can quickly set up Cloud Key Management.

Windows System Monitoring Dashboard in 5 Minutes

This video demonstrates how to quickly build a dashboard to monitor a Windows system. The dashboard shows various metrics like uptime, processor and memory utilization, disk IO, network, etc. All the values are stored in InfluxDB for advanced analysis using full history. This video shows a whole end-to-end process that only takes 5 minutes. It begins with the Windows template installation and Telegraf agent installation and configuration that captures all the metrics from the monitored machine(s).