Operations | Monitoring | ITSM | DevOps | Cloud

How to

How To Monitor Network Performance for Microsoft Teams, Office & Azure

VoIP and Unified Communication apps, such as Microsoft Teams, are more sensitive to network performance than other applications. So whether you’re working from an office, or your own home, you want to make sure your VoIP and UC apps are performing as they should be. Whether you’re an IT pro or not, you can easily monitor Microsoft network performance and quickly find network problems affecting Microsoft apps.

Get unified visibility of Azure resources under multiple subscriptions | Serverless360

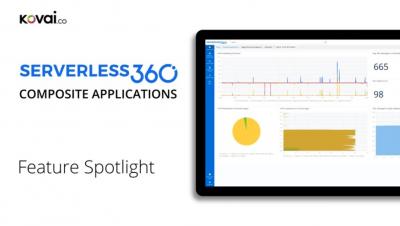
Do you have hundreds of resources under multiple Azure Subscription? Would you like to manage them in the context of business or in groups in single pane of glass? Want to provide restricted access to your team members to focus only on resources they are supposed to. Serverless360 introduces Composite Applications to group your resources in business application context or groups like staging or production.

Achieve end-to-end message tracking across Azure resources and hybrid integration | Serverless360

Serverless360 BAM is a real time hybrid integration solution can be instrumented with the business process definition to capture necessary data in all stages of the business transaction. Resolve issues faster with a unified view of business transactions and get maximum visibility on the integration solution for the functional support teams.

How to install Kubeflow on Kubernetes

In this video, we install Kubeflow in a Kubernetes agnostic fashion using Juju and Charmed Kubeflow. This video exemplifies the steps necessary to install Kubeflow on any conformant Kubernetes, including AKS, EKS, GKE, Openshift and any kubeadm-deployed cluster, provided that you have access to it via kubectl. To install Kubeflow locally, you can simply install MicroK8s and enable the Kubeflow add-on.

Monitor messages that get into your Azure Topic Subscription with Auto forwarding | Serverless360

An exciting use case from our customer has brought us back to you with a new video on Service Bus Auto Forwarding. Have you ever wondered how to listen to a queue/topic Subscription which is already being accessed by another application? Here you go, watch our video, and get hands-on experience in it.

Tutorial | How to Set Up LogDNA Ingestion Source

Centralize your logs from any source in LogDNA so that you can monitor and troubleshoot your systems and applications in a single UI. In this video, I’ll show you how to add an ingestion source. We support multiple ingestion sources, which you can learn about in our documentation portal below. In this video, we’ll show you how to ingest Kubernetes logs using the LogDNA Agent.

Tutorial | How to Custom Parsing with LogDNA

LogDNA automatically parses common log types so that you can easily view and search through them. If you have logs that aren't in a format we automatically parse, you can create a custom parsing template so they'll be parsed as well, allowing you to use them in views, alerts, boards, and graphs. In this video, we will show you how to use Custom Parsing templates for a log that we don't automatically parse, such as one from an internal application.

Tutorial | How to use LogDNA Screens

Use LogDNA Screens to display daily log activity from all of your systems or select systems. Use time-shifted graphs to aggregate data from the previous week to compare activity levels in your current week. Our screens let you create an easy-to-read dashboard containing widgets that convey metrics from your logs. These include graphs, gauges, tables, and time-shifted graphs. In this video, we'll create a screen with widgets that provide different views of your webserver's 404s.