Operations | Monitoring | ITSM | DevOps | Cloud

%term

Monitor your domain, SSL certificate, blacklists and robots.txt

Super Monitoring introduced a new type of check: “Daily Health”, which checks once a day the domain and SSL certificate’s expiration dates, the validity of the certificate, presence of the site on blacklists and detects whether the website is blocking search engine robots.

Sentry's New Java Agent: Adding Context to Your Stack Traces

We’re enhancing the existing Sentry Java SDK with our new Java agent. The thing is — it’s still in beta, and we need your feedback. Once downloaded, the agent will enhance your application stack traces on Sentry by adding the names and values of local variables to each frame. Specifically, the agent provides much more detail about the current state of the application at the time of the error than you would usually have.

Key metrics for Elasticsearch performance monitoring

Elasticsearch is a highly scalable, distributed, open-source RESTful search and analytics engine that offers log analytics, real-time application monitoring, click stream analytics, and more. Elasticsearch stores and retrieves data structures in real time. It has multi-tenant capabilities with an HTTP web interface, presents data in the form of structured JSON documents, makes full-text search accessible via RESTful API, and maintains web clients for languages like PHP, Ruby, .Net, and Java.

Jenkins in a Nutshell

In many projects, the product development workflow has three main concerns: building, testing, and deployment. Each change to the code means something could accidentally go wrong, so in order to prevent this from happening developers adopt many strategies to diminish incidents and bugs. Jenkins, and other continuous integration tools (CI) are used together with a source version software (such as GIT) to test and quickly evaluate the updated code.

Monitoring Java using JMX and custom metrics

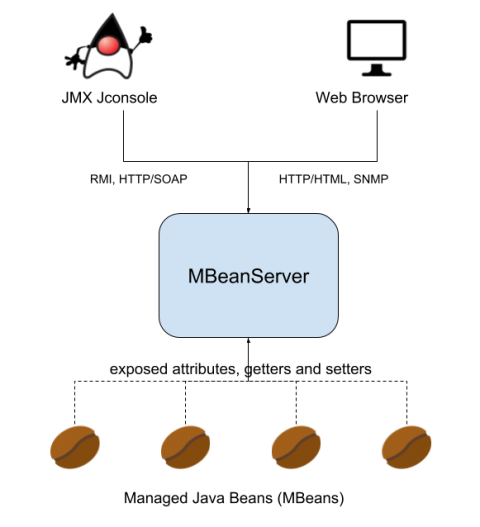
JMX (Java Management Extensions) is a set of specifications conceived to monitor and manage Java applications. To implement the JMX technology, you need to create and register MBeans (Managed Beans) as part of your Java code. Using JMX technology and tools, Java application developers can get the dynamic state of the application and use it for performance tuning, troubleshooting and debugging.

The Future of DevOps Observability: The Evolution of Logging, Monitoring and Metrics

LogDNA is uniquely positioned to have enabled thousands of customers to gain deep insights into their DevOps infrastructure. As the industry has shifted to microservices and Kubernetes we have helped our customers migrate and deploy world-class infrastructure. Based on our experience we see three main pillars when it comes to the future of DevOps: Monitoring, Analytics, and Logging.