Operations | Monitoring | ITSM | DevOps | Cloud

How to

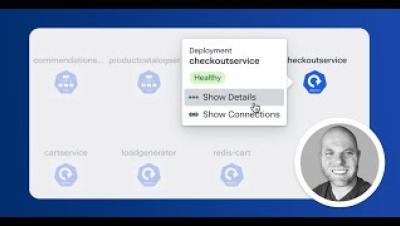
Troubleshooting Container Network Latency in Kubernetes with Kentik Kube

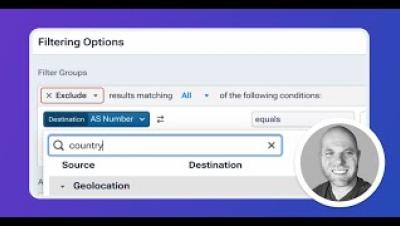
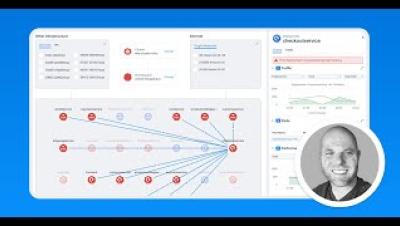
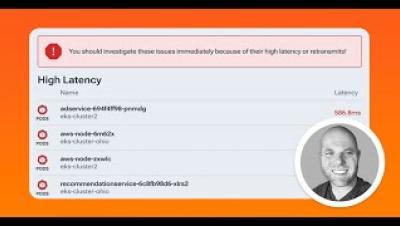
Kentik Kube brings network observability to Kubernetes. In this Kentik Kube product demo, we navigate a real-time scenario of troubleshooting high latency within a Kubernetes cluster. The Kentik Kube map offers a visualization of our environments, complete with automated alerts and the ability to correlate performance metrics directly to affected pods.

Custom Container Network Monitoring and Alerting in Kubernetes with Kentik Kube

Discover the power of proactive network monitoring in Kubernetes with Kentik Kube. This demo highlights the critical importance of custom dashboards and alerts in maintaining optimal container performance and service availability. We take you through creating a tailored alert for a checkout service within Kentik Kube. From selecting services to diving deep into performance metrics via the Kentik Data Explorer, we show you how Kentik Kube makes it easy to set up policies that monitor and alert you to Kubernetes network issues as they arise.

Troubleshooting Kubernetes Network Performance Issues with Kentik Kube

Discover the power of Kentik Kube, the solution for unparalleled network insight into Kubernetes workloads. In this video, Phil Gervasi walks us through Kentik Kube’s ability to track and visualize container traffic across data centers, public clouds, and the internet. Using the interactive Kube map, Phil demonstrates how to troubleshoot a network latency issue affecting an online shopping application, highlighting the tool's capacity for in-depth analysis of pod performance and node-to-node traffic. Learn how to create custom dashboards for custom oversight, set up proactive alerts for performance issues, and enforce security and compliance across your Kubernetes infrastructure.

Stop bugging devs for PR NITs

Make your software development process smooth & hassle-free! Discover how to automate pull request checks with Sleuth, ensuring PR standards without being a pull request police. Get coding! Give Sleuth a try and see how we give teams actionable insights on how to improve with no-code automations to instantly ship improvements, and metrics to measure their impact — all in a way that both managers and developers love.

How I stopped bugging devs for PR format NITs

Make your software development process smooth & hassle-free! Discover how to automate pull request checks with Sleuth, ensuring PR standards without being a pull request police. Get coding! Give Sleuth a try and see how we give teams actionable insights on how to improve with no-code automations to instantly ship improvements, and metrics to measure their impact — all in a way that both managers and developers love.

SolarWinds Kiwi Syslog Server Overview

SolarWinds® Kiwi Syslog® Server is an affordable on-premises solution designed to help you manage syslog messages, SNMP traps, and Windows event logs. It centralizes and simplifies log message management across network devices and servers. Kiwi Syslog Server lets you collect, filter, alert, react to, and forward syslog messages and SNMP traps, and it helps you adhere to regulatory compliance. Learn how to simplify syslog and SNMP trap management with SolarWinds Kiwi Syslog Server.