Operations | Monitoring | ITSM | DevOps | Cloud

How to

Tip of The Day : How to Best Use Incident Templates

Welcome to Statuscast.com's latest video: "How to Best Use Incident Templates," hosted by our very own Director of Customer Experience Engineering! In this power-packed tutorial, Denise Joyal will guide you through the intricacies of optimizing your incident response using Statuscast's cutting-edge Incident Templates feature.

How to Access Powerful IDEs and Containers on Any Device with Rizel Scarlett #shorts #shortsvideo

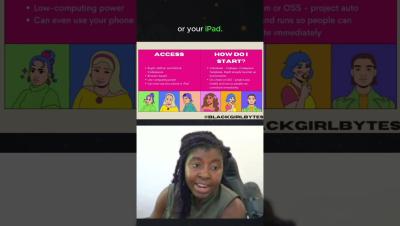
So you want to start coding, but maybe you don't have the newest PC, the fastest internet connection, a reliable workspace, or whatever else that's blocking you from moving forward. What then? 🤷‍♀️ Rizel Scarlett (@blackgirlbytes), Developer Advocate at TBD, explains how devs experiencing roadblocks can get started without all the fancy bells and whistles! While everyone's situation is unique, folks like Rizel are working hard to address and implement more robust diversity, equity, and inclusion practices in tech. One of those strategies is utilizing containers!

How to map log volume to teams with Grafana Cloud's Log Volume Explorer | Demo

Investigate the source of high log volumes in Grafana Cloud by leveraging log labels to understand which teams or applications are responsible for log usage. In this video, see how to use the Log Volume Explorer with a point-and-click user interface and explore log volumes by using any combination of labels associated with the logging data. Slice and dice the data as you choose to see log volume broken down by teams, applications, clusters, cloud region.

2023 ONUG Fall Panel Discussion: Building Integrated Solutions for Network and Security

Full-Stack Analytics explores the essence of implementing cross-layer, multi-domain analytics, emphasizing the need for an integrated platform that combines endpoint and network security telemetry for holistic threat detection. In this session, we explore the transformative role of AI and machine learning in bolstering real-time intelligence across multiple layers and domains, enhancing predictive analytics and anomaly detection.

Grafana k6 for Beginners: Why observability needs testing

Having observability and monitoring solutions is a great way to gain insights into your applications' health, behavior, and performance. However, it doesn’t prevent incidents. Observability needs a partner, and this is where Grafana k6 can help you! In this video, Marie Cruz, a Developer Advocate at Grafana Labs, explores what Grafana k6 is, why it's the missing puzzle piece in your Grafana stack, and how to get started.

Forget Inbox Zero, try PR Zero!

Pull requests are 99% waiting, and therefore waste, so in this video, you learn how to use Sleuth automations to minimize waiting and get back to doing real work. Give Sleuth a try and see how we give teams actionable insights on how to improve with no-code automations to instantly ship improvements, and metrics to measure their impact — all in a way that both managers and developers love.

Try PR zero

Pull requests are 99% waiting, and therefore waste, so in this video, you learn how to use Sleuth automations to minimize waiting and get back to doing real work. Give Sleuth a try and see how we give teams actionable insights on how to improve with no-code automations to instantly ship improvements, and metrics to measure their impact — all in a way that both managers and developers love.