Operations | Monitoring | ITSM | DevOps | Cloud
%term
How to Start Logging & Invite Team Members in LogDNA's Log Management System
How to View, Search, and Filter Logs, and Jump to Time in LogDNA's Log Management System
How to Save a View & Create Alerts in LogDNA's Log Management System
Prometheus vs. Graphite: Which Should You Choose for Time Series or Monitoring?
One of the key performance indicators of any system, application, product, or process is how certain parameters or data points perform over time. What if you want to monitor hits on an API endpoint or database latency in seconds? A single data point captured in the present moment won’t tell you much by itself. However, tracking that same trend over time will tell you much more, including the impact of change on a particular metric.
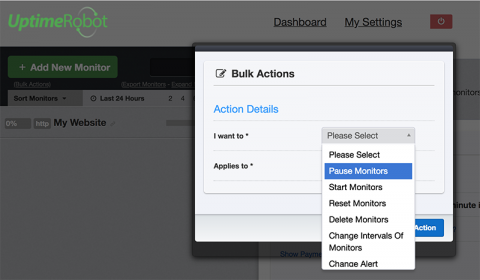
Bulk Actions Get Better!
In case you haven’t seen or used it, there is a “Bulk Actions link” just under the “Add Monitor button” in the left sidebar. It simply opens the “Bulk Actions dialog” and presents a set of actions that can be applied to monitors in bulk. This feature is now more powerful with a few important additions.
Tech news sites lagging when it comes to mobile
We all read them, and we all have our favorite technology news and media sites. Now that mobile dominates the market and Google has shifted to ranking based on mobile performance, we thought it would be fun to see how ready the top 50 technology news and media websites are for the shift using our free Website Speed Test Tool.
Three Keys to Incident Response: On-Call Schedules, Escalation Policies, and Routing Rules
Organizations are drowning in alerts, incidents, and chaos that prevent them from doing their jobs and serving their customers. Notably, for businesses who operate always-on services, an outage or downtime can be devastating to their bottom line, not to mention a poor experience for their customers and users.


