Operations | Monitoring | ITSM | DevOps | Cloud

%term

Sentry is now Fair Source

Today we’re launching Fair Source, a new approach to software sharing that is safe for companies to adopt and developers to use. Before Fair Source, companies that wanted to engage the developer community with their core products often did not know how to do so while maintaining control over their roadmap and business model. The result is that most software products today are closed-source. With Fair Source, companies have a new option. The Fair Source option is not theoretical.

Enterprise DORA Metrics: Scaling Measurement Across Value Streams and the Organization

DevOps Research and Assessment (DORA) metrics are a ubiquitous measure of DevOps performance. These metrics are used in nearly every enterprise engaged in software development. DORA metrics help measure DevOps maturity, identify bottlenecks, and guide quality and process improvements. Despite their popularity, DORA metrics are generally considered difficult to measure and are primarily used by technical teams within the context of their respective domains.

An Introduction to Last9 Levitate

Levitate is a high-cardinality monitoring tool and a telemetry data warehouse with support for metrics, events, logs, and traces. Prometheus and OpenTelemetry compatibility makes it easy to get started with a hassle-free monitoring journey, be it starting from scratch or even swapping out your existing monitoring tool. Used by engineering teams worldwide at companies like Replit, Disney+ Hotsar, Clevertap, Probo, Quickwork, Axio, and more.

An Overview of the OpenTelemetry Collector's Configuration File

In this video, I’ll provide an overview of the OpenTelemetry Collector’s configuration file (config.yaml) with examples from the Splunk distribution. I will briefly explain the components of the Splunk OTel Collector, and walk you through a sample generic configuration of the OTel Collector. We’ll then use the Splunk Observability Cloud interface to construct the commands needed to install the Splunk OTel Collector on a specific host. This installation will copy a default Splunk OTel Collector configuration onto the host, and we’ll review the Splunk specific components of this configuration.

How to Send Prometheus Metrics to Grafana Cloud Using Alloy | Ask the Experts | Grafana

"How do I push metrics using Grafana Alloy?" William Dumont from the Grafana Alloy team answers the question by showing you how to collect Prometheus metrics and forward them to Grafana Cloud using Grafana Alloy. This video is just a preview of what you can expect from our Ask the Experts booth at ObservabilityCON and GrafanaCON. The Grafanistas behind our solutions, features, and the LGTM Stack can provide answers to your toughest questions on the spot.

The 80/20 Rule of Bug Fixing

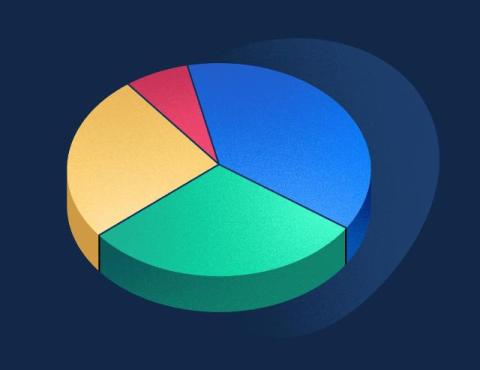
At BugSplat, we've been supporting applications and video games with crash and error reporting for a long time. Over the years, we've collaborated with a wide range of teams, handling applications of all sizes. From our experience and numerous conversations with users, we've noticed an interesting trend: the distribution of crashes isn't uniform. If your application experiences 100 crashes in a given version, those crashes aren't caused by 100 different defects.