Operations | Monitoring | ITSM | DevOps | Cloud
%term
Goliath Performance Monitor for Hospitals Using Epic
3 phases of Prometheus adoption.
How to ensure visibility into your next-generation Kubernetes environment. Having assisted hundreds of enterprises in developing a new visibility strategy as they move to Kubernetes, I’ve learned a few things about how organizations learn, evolve and adopt a new method of application observability. Open source is usually essential to developing this understanding.
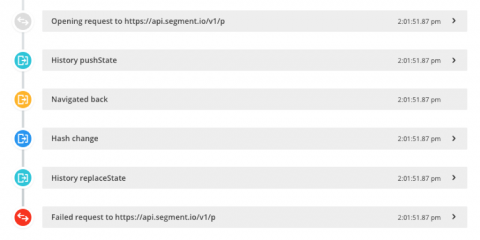
How to replicate user errors without the user with Breadcrumbs and Sessions
If you need to replicate a user error, you’ll know how difficult it can be to pinpoint the cause. Usually, you’d look at the stack trace or ask the user themselves. However, that’s a lot of guesswork, especially if the stack trace is obfuscated. We’ll show you how to replicate the error faster using Crash Reporting’s Breadcrumbs and the Real User Monitoring Sessions feature.
Monthly Snap June: Product Updates, Meetups and Events
We are planing with more events and camps in 2018/2019. Please let us know if you are interested in joining us in Washington, D.C., Tel Aviv, Berlin or Stockholm.
The Importance of Historical Log Data
Centralized log management lets you decide who can access log data without actually having access to the servers. You can also correlate data from different sources, such as the operating system, your applications, and the firewall. Another benefit is that user do not need to log in to hundreds of devices to find out what is happening. You can also use data normalization and enhancement rules to create value for people who might not be familiar with a specific log type.
Monitor Amazon EKS with AppDynamics
Amazon Elastic Container Service for Kubernetes (EKS) makes it easier to operate Kubernetes clusters, but performance monitoring remains a top challenge. AppDynamics seamlessly integrates into EKS environments, providing insights into the performance of every microservice deployed, all through a single pane of glass.
6 Reasons Why PagerDuty Engineering Stands Out From the Crowd
The other day, a newer Engineering Manager here at PagerDuty, Dileshni Jayasinghe, started a Slack thread expressing joy at how fantastic our engineering team is after attending a conference with engineering folk from other organizations. She explained that she’d shared our practice of owning what we build with someone—who then responded by gazing off into the distance and saying, “That’s my dream.”
Metrics At Scale: How to Scale and Manage Millions of Metrics (Part 2)
With businesses collecting millions of metrics, let’s look at how they can efficiently scale and deal with these amounts. As covered in the previous article (A Spike in Sales Is Not Always Good News), analyzing millions of metrics for changes may result in alert storms, notifying users about EVERY change, not just the most significant ones. To bring order to this situation, Anodot groups correlated anomalies together, in a unified alert.
6 Things You Need in an IT Incident Management Platform
Your incident management process is greatly impacted by the tools you have available. And technology is key when it comes to gaining visibility and obtaining contextual data. You need tools to send alerts when incidents arise, as well as track activity for compliance reporting purposes. Whether you’re in healthcare, information technology or work at a small MSP – you need a robust incident management platform that gives you results and helps mitigate MTTR.


