Operations | Monitoring | ITSM | DevOps | Cloud
%term
Postmortems Considered Beautiful
Outages and postmortems are a fact of life for any software engineer responsible for managing a complex system. And it can be safely said that those two words – “outage” and “postmortem,” do not carry any positive connotations in the remotest sense of the word.
Boost agility of shop floor teams for Industry 4.0
The fourth industrial revolution, Industry 4.0, is happening today. Recent progress in manufacturing automation requires fewer individuals on a shop floor to do manual work with and at machines. However, those people are now required to respond faster and more effectively to keep manufacturing up and running. Fortunately, the industrial Internet of Things (IoT) allows for applying real-time monitoring, workflow automation, predictive analytics, and other means to new verticals and businesses.
DNS in the Cloud- Solid or Not?
The Domain Name System (DNS) catalog maps text-based URLs to their specifically-numbered host systems. As the phone book or Yellow Pages of the internet, DNS governs the speed with which websites and online resources may be located, so the speed and robustness of your DNS service can have a profound impact on your internet performance overall.
How to build highly expressive check results with sensu-wrapper
I’m gearing up to attend my first Sensu Summit this year, and have gone back and watched last year’s talks that I missed. There were a lot of great talks! One technical talk that really caught my eye was Lee Briggs on sensu-wrapper. Lee introduced a wrapper utility he wrote to make it easier to use the Sensu client socket to monitor shell executables for correct operation. In this post, I’ll break down why his sensu-wrapper command is so useful.
Prometheus vs. Graphite: Which Should You Choose for Time Series or Monitoring?
One of the key performance indicators of any system, application, product, or process is how certain parameters or data points perform over time. What if you want to monitor hits on an API endpoint or database latency in seconds? A single data point captured in the present moment won’t tell you much by itself. However, tracking that same trend over time will tell you much more, including the impact of change on a particular metric.
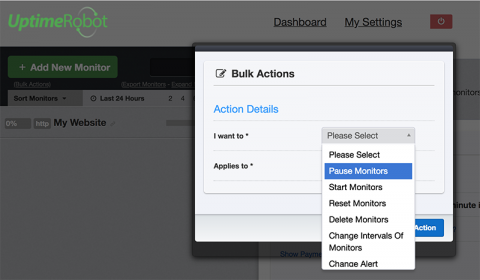
Bulk Actions Get Better!
In case you haven’t seen or used it, there is a “Bulk Actions link” just under the “Add Monitor button” in the left sidebar. It simply opens the “Bulk Actions dialog” and presents a set of actions that can be applied to monitors in bulk. This feature is now more powerful with a few important additions.
Tech news sites lagging when it comes to mobile
We all read them, and we all have our favorite technology news and media sites. Now that mobile dominates the market and Google has shifted to ranking based on mobile performance, we thought it would be fun to see how ready the top 50 technology news and media websites are for the shift using our free Website Speed Test Tool.
Three Keys to Incident Response: On-Call Schedules, Escalation Policies, and Routing Rules
Organizations are drowning in alerts, incidents, and chaos that prevent them from doing their jobs and serving their customers. Notably, for businesses who operate always-on services, an outage or downtime can be devastating to their bottom line, not to mention a poor experience for their customers and users.


