Operations | Monitoring | ITSM | DevOps | Cloud

Tracing

The latest News and Information on Distributed Tracing and related technologies.

A Recap of the KubeCon + CloudNativeCon Observability Track

OpenTelemetry has evolved so much since the 2019 KubeCon North America in San Diego, where I live-demoed OpenTelemetry on the keynote stage and highlighted our alpha to the world. We’re excited to be entering general availability of our Collector and Tracing SDKs soon. While I missed the energy from the packed crowd of over 10,000 technologists cheering me on, it was wonderful that this year’s event was more accessible than ever to a worldwide audience.

Announcing Honeycomb support for event ingestion with OTLP

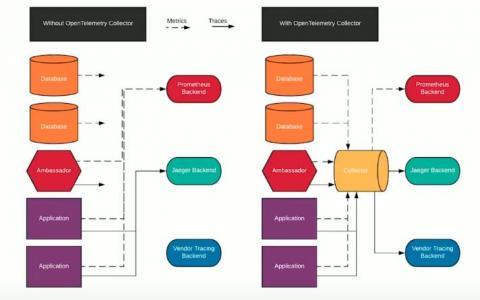
Today, AWS announced enhancements for AWS Distro for OpenTelemetry. We’re working with AWS to build in additional support from partners. In tandem with that launch, Honeycomb is announcing support for event ingestion using OpenTelemetry Protocol (OTLP). With that change, you can simplify management overhead and configuration by no longer needing to maintain a separate OpenTelemetry exporter.

Instrumenting Node.js for Tracing in Jaeger

There is more to Distributed Tracing with Jaeger than just capturing machine data as with metrics, or tailing log files. To start, you should read this primer. In this article, I will walk you through the initial principles you’ll need before executing anything within your codebase. This is going to focus on Node.js, as slight differences and concerns exist for browser applications.

How to find traces in Tempo with Elasticsearch and Grafana

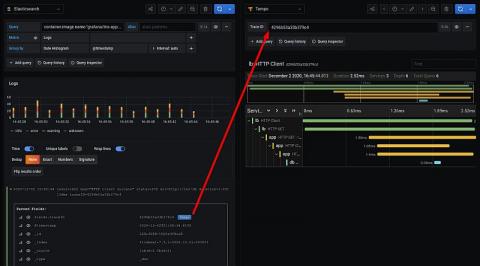
Grafana Tempo, the recently announced distributed tracing backend, relies on integrations with other data sources for trace discovery. Tempo’s job is to store massive amounts of traces, place them in object storage, and retrieve them by ID. Logs and other data sources allow users to quickly and more powerfully jump directly to traces than ever before. Previously we investigated discovering traces with Loki and exemplars.

Beginner's Guide to Jaeger + OpenTracing Instrumentation for Go

This post aims to provide a very simple beginner’s guide to Jaeger + OpenTracing instrumentation for Go applications (the terms “application” and “service” is used interchangeably in this document) via a working example. If you are new to instrumentation, I recommend that you first read this post for a practical introduction to instrumentation for Jaeger and OpenTracing. You can also get more info on using logs in Go.

Jaeger Essentials: Introduction to Jaeger Instrumentation

Every journey in distributed tracing starts with instrumenting an application to emit or extract trace data from each service as they execute. There are many ways to instrument, including the use of SDKs and pre-configured frameworks, and many protocols for transmitting the trace data to the analysis tool.

Onboard your tracing data to Sumo Logic even faster with AWS OpenTelemetry distro (preview)

We at Sumo Logic believe in an open, flexible, community-driven approach to collecting observability data. Those reasons are outlined in one of my recent blogs. In that publication, I share the belief that an application’s observability gains traction from the fact that telemetry signals are designed, composed, and produced by an application developer/vendor in compliance with industry standards, and are not a proprietary, black box component of the monitoring vendor.

Mix & Match! Tracing Header Interoperability Between OpenTelemetry and Beelines

We’ve released support for tracing header interoperability in all of our Beelines. This means you can now mix and match distributed services instrumented with Beelines or with OpenTelemetry, and your traces will be preserved in Honeycomb!