Operations | Monitoring | ITSM | DevOps | Cloud

Tracing

The latest News and Information on Distributed Tracing and related technologies.

Can Distributed Tracing Replace Logging?

Logging has been around since programming began. We use logs to debug issues and understand how software works at the code level. After logging and debuggers, profilers are a dev’s best friend when writing code and may run in production with limits to reduce overhead. As we distributed architectures — making systems more complex — centralized log aggregation was soon necessary. At that point, we had to analyze this data. Hence, log analytics technologies were born.

Logs and Traces: Two Houses Unalike in Dignity

Intelligent Medical Objects (IMO) and its clinical interface terminology form the foundation healthcare enterprises need, including effective management of Electronic Health Record (EMR) problem lists and accurate documentation. Over 4,500 hospitals and 500,000 physicians use IMO products on a daily basis. With Honeycomb, the engineering team at IMO was able to find hidden architectural issues that were previously obscured in their logs.

Monitoring Java applications with Elastic: Multiservice traces and correlated logs

In this two-part blog post, we’ll use Elastic Observability to monitor a sample Java application. In the first blog post, we started by looking at how Elastic Observability monitors Java applications. We built and instrumented a sample Java Spring application composed of a data-access microservice supported by a MySQL backend. In this part, we’ll use Java ECS logging and APM log correlation to link transactions with their logs.

Jaeger Essentials: Jaeger Persistent Storage With Elasticsearch, Cassandra & Kafka

Running systems in production involves requirements for high availability, resilience and recovery from failure. When running cloud native applications this becomes even more critical, as the base assumption in such environments is that compute nodes will suffer outages, Kubernetes nodes will go down and microservices instances are likely to fail, yet the service is expected to remain up and running.

Configuring the OpenTelemetry Collector

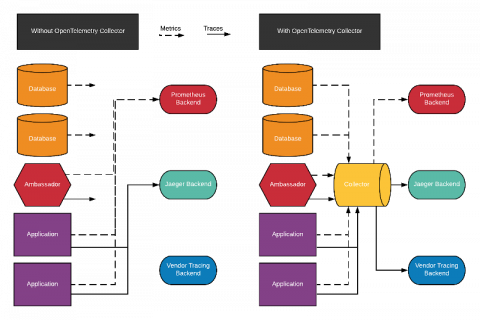
The OpenTelemetry Collector is a new, vendor-agnostic agent that can receive and send metrics and traces of many formats. It is a powerful tool in a cloud-native observability stack, especially when you have apps using multiple distributed tracing formats, like Zipkin and Jaeger; or, you want to send data to multiple backends like an in-house solution and a vendor. This article will walk you through configuring and deploying the OpenTelemetry Collector for such scenarios.

Instant Insights for Troubleshooting Your Spring Boot Applications and Spring Cloud Data Flow Pipelines

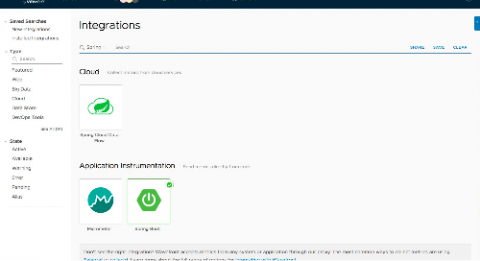
Looking for a way to proactively troubleshoot complex application performance issues? Look no further than Tanzu Observability by Wavefront, which provides easy data ingestion and preconfigured dashboards and can be set up with Spring Boot and Spring Cloud Data Flow (SCDF) integrations.

Splunk Now Top Contributor to OpenTelemetry

Editor’s note: This post is a collaboration between Tim Tully, Splunk CTO, and Spiros Xanthos, Splunk’s vice president of product management for observability and IT Ops and previously the founder and CEO of Omnition. My love for the open-source software movement began with Linux in the ’90s and grew during my time at Yahoo! in the early days of Hadoop.

Interview with Honeycomb Engineer Chris Toshok: Dogfooding OpenTelemetry

At Honeycomb, we talk a lot about eating our own dogfood. Since we use Honeycomb to observe Honeycomb, we have many opportunities to try out UX changes ourselves before rolling them out to all of our users. UX doesn’t stop at the UI though! Developer experience matters too, especially when getting started with observability. We often get questions about the difference between using our Beeline SDKs compared with other integrations, especially OpenTelemetry (abbreviated “OTel”).

NodeJS Instrumentation - Adding Custom Tags to Spans | Datadog Tips & Tricks

In part 1 of this 4 part series, you’ll learn how to use manual instrumentation to add additional detail to traces. We’ll add new tags, or attributes, to the spans generated by our NodeJS application, allowing for more insightful data visualizations in App Analytics.

NodeJS Instrumentation - Creating Custom Spans for Method-Level Visibility | Datadog Tips & Tricks

In part 2 of this 4 part series, you’ll learn how to instrument your NodeJS application to capture custom method-level spans, allowing visibility into how specific methods behave in your application. Flame graphs allow for deep insight into the performance of your code. During instrumentation, we can capture custom spans for deeper layers of visibility in the resulting flame graphs. In this video, we use instrumentation to capture a method-level span, allowing us to see the performance of that specific method in our flame graphs in the Datadog UI.