Operations | Monitoring | ITSM | DevOps | Cloud
Analytics
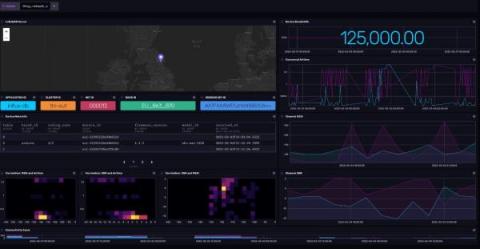
Revisiting The Things Network: Connecting The Things Network V3 to InfluxDB
Back in 2019, David Simmons created an awesome blog introducing LoRaWAN devices and The Things Network. He also showed you how easy it was to connect The Things Network V2 to InfluxDB. Since then, a few things have changed and I thought it was time to revisit the Things Network with a new project.
Create trust and value with Aiven
Apache Flink SQL Ask-Me-Anything
How Aiven helps you build engineering value
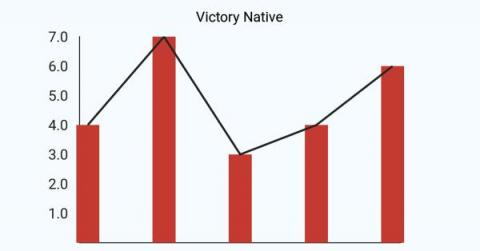
How to Make Data Visualizations with React Native - Victory Charts Tutorial
A nice dashboard can make or break your app. In this tutorial, you will learn how to make iOS and Android charts and data visualizations using React Native and the Victory Native charting library.
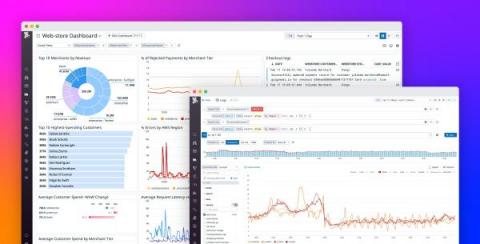
Use Log Analytics to gain application performance, security, and business insights
Whether you’re investigating an issue or simply exploring your data, the ability to perform advanced log analytics is key to uncovering patterns and insights. Datadog Log Management makes it easy to centralize your log data, which you can then manipulate and analyze to answer complex questions.
What is MySQL?
Orchestrate Spark pipelines with Airflow on Ocean for Apache Spark
Insights from the 2022 Gartner Report on AI for CSP Networks and how Autonomous Network Monitoring Fits In
Last month Gartner published its first ever “Market Guide for AI Offerings in CSP Network Operations,” and we’re excited to share that Anodot has been identified as a Representative Vendor in the report. According to the Gartner report, “CSPs are focusing on automation of their network operations to improve efficiency and customer experience, and mitigate security concerns.” The market guide presents many new and actionable insights.


