Operations | Monitoring | ITSM | DevOps | Cloud

APM

The latest News and Information on Application Performance Monitoring and related technologies.

Sponsored Post

A guide to Apdex score: Calculations, improvements, and more

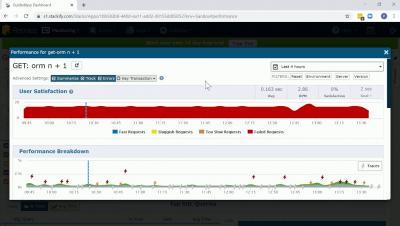
Apdex scores are a fantastic, simple tool you can use today to better understand how your development team is doing, how it can be improved, and the impact of almost every change to your service. They're also likely a part of your Service Level Agreements (SLAs) with your customers, which help them understand your platform's availability.

Elastic Stack Version 6.5: Feature Tour

The Elastic Stack 6.5 is packed full of features like cross-cluster replication of Elasticsearch data, Canvas (for presenting live Elasticsearch data), Kibana spaces (for organizing dashboards and visualizations), the Infrastructure UI, Beats Central Management, the Rollups UI, Functionbeat (for serverless shipping of your cloud data), enhancements for Elastic APM, and more.

Setting Up Application Performance Monitoring with the ELK Stack and Logz.io

Application Performance Monitoring, aka APM, is one of the most common methods used by engineers today to measure the availability, response times and behavior of applications and services. There are a variety of APM solutions in the market but if you’re familiar with the ELK Stack or are a Logz.io user, this article describes using a relatively new open source-based solution — Elastic APM.

Gartner positions SCOM as a top APM tool

SCOM surged forward as an application performance management (APM) tool this summer. It received a Customers’ Choice 2018 award from Gartner in the APM category. SCOM shared the honour with AppDynamics, Dynatrace, New Relic and Solarwinds. I see you thinking – how did this happen? Well, more than 50 reviewers gave SCOM an average rating of 4.2, which means it met Gartner’s criteria to win the award.