Operations | Monitoring | ITSM | DevOps | Cloud
Announcing support for the AWS managed Lambda Layer for OpenTelemetry
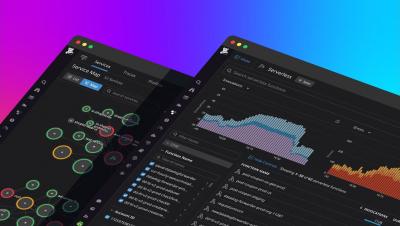
Datadog’s support of OpenTelemetry—a vendor-agnostic, open source set of APIs and libraries for collecting system and application telemetry data—has helped thousands of organizations implement monitoring strategies that complement their existing workflows. Many of our customers leverage OpenTelemetry for their server- and container-based deployments, but also need visibility into the health and performance of their serverless applications running on AWS Lambda.
Datadog Serverless Monitoring
Datadog Mobile RUM now supports React Native monitoring
React Native is an open source framework for building cross-platform mobile applications. With React Native, developers can easily reuse the same JavaScript code for iOS, Android, and the browser, with only minimal need to accommodate specific platforms.
Monitor cloud endpoint health with Datadog's cloud service autodetection
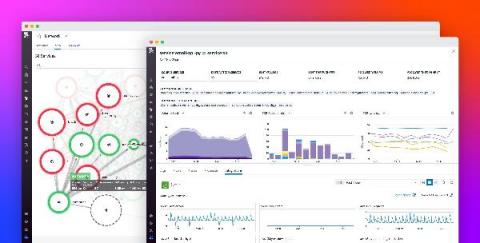
Your modern cloud-hosted applications rely on a number of key components—such as databases and load balancers—that are managed by the cloud provider. While these cloud resources can reduce the overhead of maintaining your own infrastructure, capturing and contextualizing monitoring data from services you don’t own can be difficult.
Introducing Datadog in 45 seconds
Detect unauthorized third parties in your AWS account
Detecting when an unauthorized third party is accessing your AWS account is critical to ensuring your account remains secure. For example, an attacker may have gained access to your environment and created a backdoor to maintain persistence within your environment. Another common (and more frequent) type of unauthorized access can happen when a developer sets up a third-party tool and grants it access to your account to monitor your infrastructure for operations or optimize your bill.
How to monitor HashiCorp Vault with Datadog
In this series, we’ve introduced key HashiCorp Vault metrics and logs to watch, and looked at some ways to retrieve that information with built-in monitoring tools. Vault is made up of many moving parts, including the core, secrets engine, and audit devices. To get a full picture of Vault health and performance, it’s important to track all these components, along with the resources they consume from their underlying infrastructure.
Tools for HashiCorp Vault monitoring
In Part 1, we looked at the key metrics for monitoring the health and performance of your HashiCorp Vault deployment. We also discussed how Vault server and audit logs can give you additional context for troubleshooting issues ranging from losses in availability to policy misconfiguration. Now, we’ll show you how to access this data with tools that ship with Vault.
Debug Android crashes faster with Datadog
Technical issues, such as fatal crashes, are one of the biggest reasons why users uninstall mobile applications, so quickly identifying and resolving issues is vital for user retention. This can be challenging, particularly in the Android market, which has a wide variety of mobile devices and versions of the Android operating system. You need visibility into every issue so you can determine which crashes impact your application the most and efficiently resolve them.
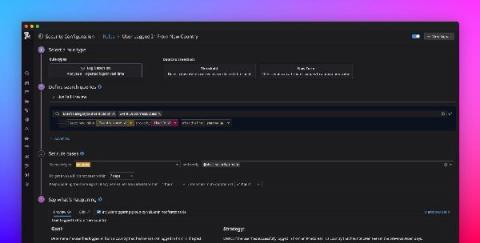
Detect anomalous activity in your environment with new term-based Detection Rules
When it comes to securing your production environment, it’s essential that your security teams are able to detect any suspicious activity before it becomes a more serious threat. While detecting clear-cut attacker techniques is essential, being able to spot unknowns is vital for full security coverage.
Datadog receives a "Leader" distinction in Gartner's 2021 Magic Quadrant for APM
This week, Gartner published the 2021 Magic Quadrant for Application Performance Monitoring, which positions vendors according to their ability to execute and the completeness of their vision. This year, Datadog placed higher and further in both categories to move from our previous “Visionary” distinction, which we received the first time we were included on the Quadrant, into the “Leader” quadrant.
Datadog On Agent Integration Development
Bits of Security, Security Panel
Bits of Security
Bits of Security, Snyk.io: Stranger Danger: Finding Security Vulnerabilities Before They Find You!
Bits of Security, PedidosYa: Fraud Detection using Datadog and Sherlock
Datadog acquires Sqreen to strengthen application security
We began our security journey last year with the release of Datadog Security Monitoring, which provides runtime security visibility and detection capabilities for your environment. Today, we are thrilled to announce that Sqreen, an application security platform, is joining the Datadog team. Together, these products further integrate the work of security, development, and ops teams—and provide a robust, full-stack security monitoring solution for the cloud age.
Monitor Azure Service Health events with Datadog
Azure Service Health continuously notifies you of issues that may affect the availability of your environment, such as service incidents, planned maintenance periods, or regional outages. We’ve recently enhanced our Azure integration to include additional support for monitoring Service Health issues, enabling you to keep tabs on the health of your Azure environment and take proactive measures to mitigate downtime.


