Operations | Monitoring | ITSM | DevOps | Cloud
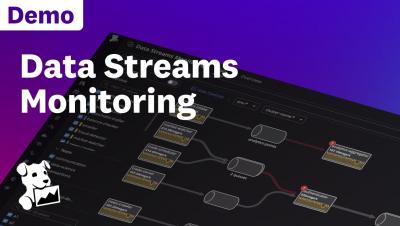
Data Streams Monitoring Demo
Container Security Fundamentals - Linux Namespaces (Part 3): The Network Namespace
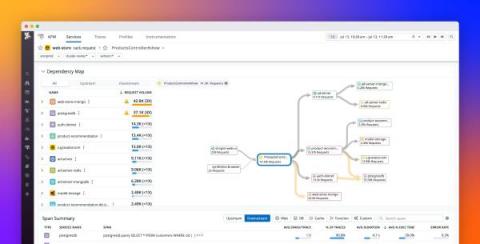
Pinpoint performance issues in downstream services with the Dependency Map Navigator
Visibility into the upstream and downstream dependencies of your services is key to maintaining a performant microservices environment. Application developers and SREs rely on this visibility to quickly trace issues back to the source, which is essential during incidents—when time is of the essence—throughout day-to-day operations, and as systems evolve and scale.
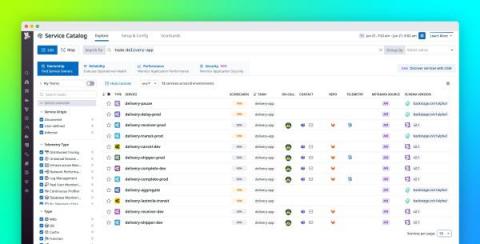
Import Backstage YAML files into Datadog to manage all your services in one place
The Datadog Service Catalog centralizes your organization’s knowledge about the ownership, reliability, performance, costs, and security of your services. If you’re also using Backstage to keep track of your services, you can leverage our support for Backstage YAML to easily consolidate and maintain all your service information in the Service Catalog.
Understanding AWS Lambda proactive initialization
AJ Stuyvenberg is a Staff Engineer at Datadog and an AWS Serverless Hero. A version of this post was originally published on his blog. In AWS Lambda, a cold start occurs when a function is invoked and an idle, initialized sandbox is not ready to receive the request. Features like Provisioned Concurrency and SnapStart are designed to reduce cold starts by pre-initializing execution environments.
Monitor your NVIDIA GPUs with Datadog
NVIDIA is well known for its computing advancements across a broad range of industries and has become the clear leader in the artificial intelligence (AI) space. Due to their high-performance capabilities, NVIDIA’s discrete graphics processing units (GPUs) now account for approximately 80 percent of the market share for production-level AI, gaming, graphics rendering, and other complex data processing tasks.
Query unsampled logs in real time with Live Search
With thousands of logs generated every minute from your infrastructure, applications, services, and devices, retaining this copious amount of data for active search and analysis can be cost-prohibitive. Because log volumes continue to grow rapidly as operations scale, it’s common for organizations to implement log management strategies and store only a limited number to minimize costs.
I use GitHub Actions for Datadog's Service Catalog, and you should, too
Today’s guest blog is by Mike Stemle, a software engineer and Principal Architect for the Arc XP division of the Washington Post. In his role, Mike focuses on AppSec and large-scale architecture. Anybody who works with me knows that I love the Datadog Service Catalog.
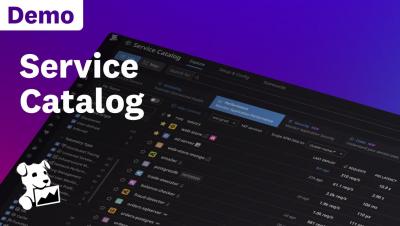
Datadog Service Catalog Demo
Best practices for monitoring static web applications
Static sites are currently a popular solution for many lightweight web applications, such as corpsites, blogs, job listings, and documentation repositories. In static web architecture, pages are generated and pre-rendered at build time from markup files, and usually cached in a content delivery network (CDN) for efficient delivery. This saves teams the effort and cost of server management while enabling fast page load times.
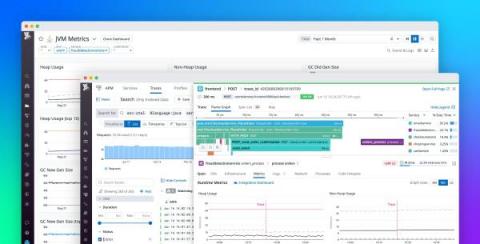
Monitor runtime metrics from OTel-instrumented apps with Datadog APM
OpenTelemetry (OTel) is an open source, vendor-neutral observability framework that supplies APIs, SDKs, and tools for the instrumentation of applications and services. As part of our ongoing commitment to OTel, we are excited to announce support for the ingestion and visualization of runtime metrics from OTel-instrumented applications in Java, .NET, and Go.
Datadog On WebRTC
Datadog named Leader in 2023 Gartner Magic Quadrant for APM and Observability
We are thrilled to announce that, for the third consecutive year, Datadog has been named a Leader in the 2023 Gartner® Magic Quadrant™ for APM and Observability. We believe that this placement reflects Datadog’s continued commitment to understanding our customers’ most complex challenges and building products and services that give them the visibility they need into their applications.
Monitor Windows event logs with Datadog
Whenever an event occurs on your Windows machine, the operating system records an event log that includes details about the nature of the event (e.g., critical runtime error) or security identifiers (for audit events). Windows event logs not only record system and application activity but also user actions and background processes, making them an invaluable tool for monitoring the security and health of your systems.


