Operations | Monitoring | ITSM | DevOps | Cloud

January 2025

Monitor dbt Cloud with Datadog

Data build tool (dbt) is an open source service that cleans, aggregates, and models raw data into organized, analytics-ready formats within a data warehouse. dbt Cloud, a fully managed platform by dbt Labs, extends dbt’s capabilities with advanced features such as scheduling, testing, and monitoring, accessible directly from your browser.

Datadog On-Call, Code Analysis & More - This Month's Updates! #Observability #opentelemetry

On This Month in Datadog, we’re bringing you a bonus episode to spotlight Datadog On-Call, which is now generally available, and covering other updates, including the general availability of Code Analysis and our expanded integration with Pinecone.

This Month in Datadog - January 2025

On the January episode of This Month in Datadog, join Jeremy Garcia (VP of Technical Community and Open Source) and Daljeet Sandu (Product Manager) for a bonus video that spotlights Datadog On-Call, which is now generally available. Also featured is a roundup of new features that Datadog recently announced. This Month in Datadog is a monthly update of the company’s latest features, product announcements, and more. Subscribe to our YouTube channel to get notifications about future episodes.

This Month in Datadog: Datadog On-Call is now generally available

Datadog is constantly elevating the approach to cloud monitoring and security. This Month in Datadog updates you on our newest product features, announcements, resources, and events. To learn more about Datadog and start a free 14-day trial, visit Cloud Monitoring as a Service | Datadog. This month, we put the Spotlight on Datadog On-Call.

Intro to Synthetic Monitoring

Welcome to the second video of our new series, Frontend Observability & Monitoring! Datadog Synthetic Monitoring is a proactive monitoring solution that enables you to create code-free API, browser, and mobile tests to automatically simulate end-user workflows and requests on your front-end applications. This video will walk you through setting up browser and api testing capabilities so you can keep tabs on your application uptime and ensure a reliable user experience.

Monitor unit economics with Datadog Cloud Cost Management

Cloud unit economics measures the amount an organization spends on cloud services to achieve a discrete business outcome such as a conversion, sign-up, or checkout. Your cloud spending may increase as your applications get more usage and the complexity of your cloud environment grows.

Unify visibility into changes to your services and dependencies with Datadog Change Tracking

In modern application development, changes happen constantly: Deployments are pushed, feature flags are toggled, and Kubernetes events reshape infrastructure, to name just a few. While these practices drive innovation and scalability, they also introduce complexity—especially during incidents. Fragmented tools and workflows across teams and organizations make it difficult to pinpoint the root causes of issues, leading to longer resolution times.

How to monitor your Rust applications with OpenTelemetry

Rust’s strong memory safety and efficient code execution make it a top choice for building robust, high-performance systems. But even with its powerful guarantees around memory management and thread safety, Rust applications in production environments can still face challenges such as latency spikes, resource contention, and unexpected bottlenecks. For this reason, monitoring Rust applications is essential to ensure they meet performance expectations and remain reliable under load.

Optimizing Contract Management at Icertis with Datadog

Icertis is a leading contract lifecycle management (CLM) platform that empowers organizations to manage their contracts effectively from initiation to renewal. By leveraging advanced AI and analytics, Icertis helps businesses ensure compliance, mitigate risks, and drive better decision-making. The integration of Datadog has tripled the speed of incident detection and resolution, achieving a 20-30% reduction in overall MTTR and saving approximately $500,000 USD through optimized infrastructure scaling at Icertis.

Stay ahead of service disruptions with Watchdog Cloud & API Outage Detection

Even with the best monitoring in place, outages are unavoidable. Complex, modern IT environments rely on multiple third-party services, including critical cloud and API providers, and when any one of those goes down, it can trigger a domino effect of increased error rates and latency spikes across your system. And, because you don’t have as much visibility into external services, it can be difficult to identify that the problem is due to an outside outage or disrupted service.

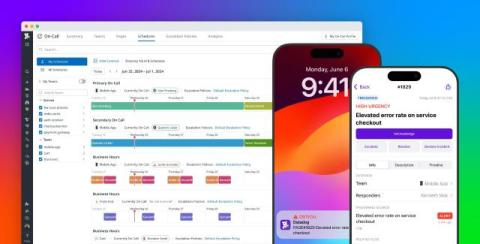
Enrich your on-call experience with observability data at your fingertips by using Datadog On-Call

The stress, sudden disruptions, and high stakes of resolving issues while on call is one of the most challenging aspects of an engineer’s job. Many organizations, from startups to large enterprises, still struggle with their on-call experience, which leads to longer resolution times and lower employee retention rates. Constant context switching, managing multiple tools, and racing against time to resolve issues can cause frustration, burnout, and inefficiency.

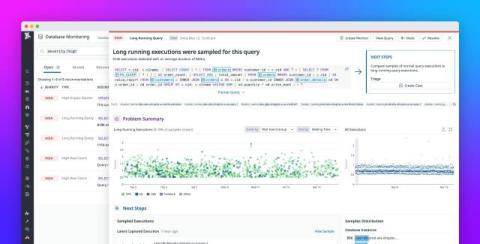
Improve database host and query performance with Database Monitoring Recommendations

Modern applications rely on databases, making database performance and reliability essential. As systems grow in scale and complexity, identifying the impact and addressing the root causes of database performance issues—such as long query durations or missing indexes—becomes increasingly challenging. Datadog Database Monitoring (DBM) Recommendations address these challenges by providing a clear, prioritized view of performance bottlenecks.

Monitor Cloud Run with Datadog

In part 1 of this series, we introduced the key Cloud Run metrics you should be monitoring to ensure that your serverless containerized applications are reliable and can maintain optimal performance. In part 2, we walked through a couple of Google Cloud’s built-in monitoring tools that you can use to view those key metrics and check on the health, status, and performance of your serverless containers.

How to collect Google Cloud Run metrics

In Part 1 of this series, we looked at key Cloud Run metrics you can monitor to ensure the reliability and performance of your serverless containerized workloads. We’ll now explore how you can access those metrics within Cloud Run and Google’s dedicated observability tool, Cloud Monitoring. We’ll also look at several ways you can view and explore logs and traces in the Cloud Run UI and Google Cloud CLI.

Key metrics for monitoring Google Cloud Run

Google Cloud Run is a fully managed platform that enables you to deploy and scale container-based serverless workloads. Cloud Run is built on top of Knative, an open source platform that extends Kubernetes with serverless capabilities like dynamic auto-scaling, routing, and event-driven functions. By using Cloud Run, developers can simply write and package their code as container images and deploy to Cloud Run—all without worrying about managing or maintaining any underlying infrastructure.

Accelerate root cause analysis with Watchdog and Faulty Kubernetes Deployment

Understanding and managing the impact of Kubernetes changes is one of the biggest challenges for modern DevOps teams. Every modification to a manifest, whether it’s adjusting memory limits, tweaking CPU allocations, or updating container images, has the potential to destabilize services or degrade performance.

Unlock advanced query functionality with distribution metrics

As organizations break down monolithic applications in favor of a more distributed, microservices-based architecture, they need to collect increasing amounts of metric data. But how do you summarize this data to provide insights at scale? Averages are simple to calculate but can be misleading, especially for increasingly complex and distributed environments that contain outlier values that skew the average.

Investigate memory leaks and OOMs with Datadog's guided workflow

Containerized application crashes due to exceeding memory limits are often tricky to investigate as they can be caused by different underlying issues. A program might not be freeing memory properly, or it might just not be configured with appropriate memory limits. Investigation methods also differ based on the language and runtime your program uses.

Datadog on LLMs: From Chatbots to Autonomous Agents

As companies rapidly adopt Large Language Models (LLMs), understanding their unique challenges becomes crucial. Join us for a special episode of "Datadog On LLMs: From Chatbots to Autonomous Agents," streaming directly from DASH 2024 on Wednesday, June 26th, to discuss this important topic. In this live session, host Jason Hand will be joined by Othmane Abou-Amal from Datadog’s Data Science team and Conor Branagan from the Bits AI team. Together, they will explore the fascinating world of LLMs and their applications at Datadog.

Datadog acquires Quickwit

Organizations in financial services, insurance, healthcare, and other regulated industries must meet stringent data residency, privacy, and regulatory requirements while maintaining full visibility into their systems. This becomes challenging when logs need to remain at rest in customers’ environments or specific regions, hindering teams’ ability to attain seamless observability and insight.

Kickstart your investigations and reduce alert noise with Doctor Droid's offering in the Datadog Marketplace

Being an on-call engineer is often overwhelming, requiring you to pivot between tickets, dashboards, runbooks, and different data sources as you try to separate legitimate incidents from unnecessary noise. Not only does the process of investigating irrelevant alerts take time away from remediating important issues, but it also compounds alert fatigue.

How to monitor Snowflake performance and data quality with Datadog

In Part 2 of this series, we looked at Snowflake’s built-in monitoring services for compute, query, and storage. In this post, we’ll demonstrate how Datadog complements and extends Snowflake’s existing monitoring and data visualization capabilities, enabling teams to get deeper visibility and extract more valuable insights from their Snowflake data.

Tools for collecting and monitoring key Snowflake metrics

In Part 1 of this series, we looked at how Snowflake enables users to easily store, process, analyze, and share high volumes of structured and semi-structured data, as well as key metrics for monitoring compute costs, storage, and datasets. In this post, we’ll walk through how to collect and analyze these metrics using Snowsight, Snowflake’s built-in web interface.

Key metrics for monitoring Snowflake cost and data quality

Snowflake is a self-managed data platform that enables users to easily store, process, analyze, and share high volumes of structured and semi-structured data. One of the most popular data platforms on the market, Snowflake has gained widespread adoption because it addresses a range of data challenges with a unified, scalable, and high-performance platform. Snowflake’s flexibility enables users to handle diverse workloads, such as data lake and data warehouse integration.

Monitor your multi-cloud costs with Cloud Cost Management and FOCUS

Monitoring cloud costs can be complex. When those costs span more than one cloud service provider (CSP) or SaaS provider, that complexity can make it difficult to understand your overall spending. Datadog Cloud Cost Management (CCM) enables teams to understand cloud costs, but each provider tags its cost data differently. Teams need to understand each provider’s unique cost data model before they can make sense of their costs in each cloud.

Monitor your Google Gemini apps with Datadog LLM Observability

Google’s comprehensive AI offering includes Vertex AI, a cloud-based platform for building and deploying AI applications, AI Studio, a web platform for quickly prototyping and testing AI applications, and Gemini, their multimodal model. Gemini offers advanced capabilities in image, code, and text generation and can be used to implement chatbot assistants, perform complex data analysis, generate design assets, and more.