Dashboards

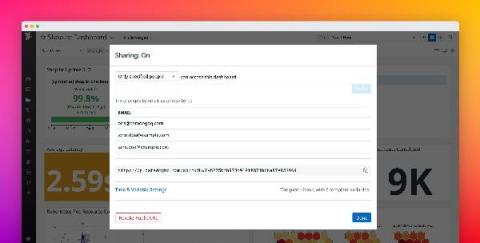
Share Datadog dashboards securely with anyone outside of your organization

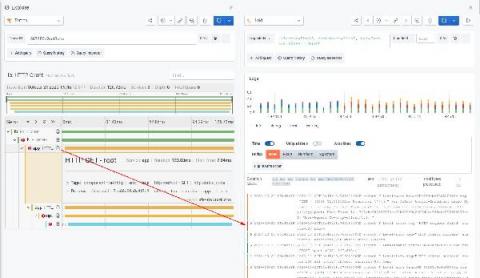
Datadog dashboards provide a unified view of your application, infrastructure, and business data, giving stakeholders the context they need to make decisions. Sharing dashboards publicly is useful when you want to make them easily accessible to a large audience. But oftentimes, your dashboards include sensitive information, which is why you need finer-grained controls over the data you share—and who you share it with.

Dashboards Beta v0.9: All Things Inputs

If you’re new to the Splunk Dashboards app (beta) on Splunkbase and you’re trying to get started with building beautiful dashboards, this blog series is a great place to start. The Splunk Dashboards app (beta) brings a new dashboard framework, intended to combine the best of Simple XML and Glass Tables, and provides a friendlier experience for creating and editing dashboards.

Why choose the Connect license for SquaredUp 5.0?

Every enterprise has its arsenal of tech tools to tackle an array of different challenges. Useful, and necessary, but often a pain to monitor. Whatever your data sources, being able to bring all these metrics into a unified dashboard provides valuable context, which in turn helps you identify and correlate problems more quickly, resulting in improved reaction time and decision making.

Why Grafana Labs delivers the best Prometheus in the Cloud

Over the last several months, there have been a variety of service providers that have launched Managed Prometheus offerings. This is a testament to the rise in popularity of the Prometheus project, and how it’s becoming a de facto standard for metrics. The most recent announcement in the Managed Prometheus landscape came from AWS. During a re:Invent keynote on Dec. 15, Amazon announced its AWS Managed Service for Prometheus.

New and improved Web API tile with SquaredUp 5.0

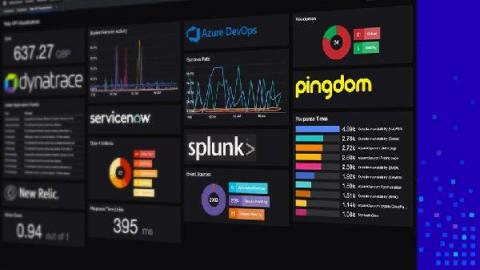
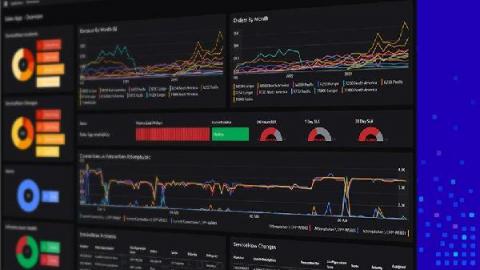
Being able to visualize data from all of your tools in a unified dashboard experience has become critical to most enterprises today. With SquaredUp dashboards, you can not only correlate data from SCOM and Azure, but also surface critical information from your other tools and data sources – including ServiceNow, Azure Log Analytics, App Insights, all SQL databases and any Web API. In short, you can get unified dashboards with real-time operational intelligence for all teams across all tools.

Introducing a new dashboard creation experience in Cloud Monitoring

Having good observability is vital to the health of your cloud infrastructure and applications, and a key element to using that information effectively is being able to create dashboards with relevant metrics. Today we are announcing a new dashboard creation experience from Cloud Monitoring that allows you to generate a greater variety of visualization types, introduces better flexibility for dashboard layouts, and makes data manipulation easier so you can create dashboards that better fit your needs.

New Open Access with SquaredUp 5.0

Our Open Access feature enables easy, and unlimited sharing of dashboards across your organization – with any audience at all. A highly popular feature, these shared dashboards help you bring better visibility and collaboration – conveying the shared “truth”! With our latest release SquaredUp 5.0, we have made Open Access dashboards fully interactive, like the rest of our dashboards, so you can see that next level of detail you’ve been wanting.

With the new AWS IoT SiteWise plugin, you can visualize and monitor your equipment data in Grafana dashboards

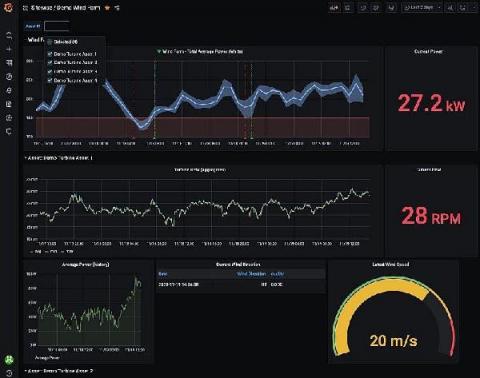
In collaboration with the AWS team, we have just launched another AWS integration, the AWS IoT SiteWise plugin for Grafana. AWS IoT SiteWise is a managed service that helps users collect, store, organize, and monitor data from industrial equipment, across facilities, at scale.

New Magic Dashboard for Ruby on Rails: ActionMailer

Monitoring your application can be a difficult task if you’re just getting started with it. You need to know which metrics matter most and understand which ones you can combine into meaningful graphs. In the (not just holiday ⛄️) spirit of making things smoother for our users, we’ve added a magic dashboard to the Ruby integration that shows you the volume of emails you are sending with ActionMailer.