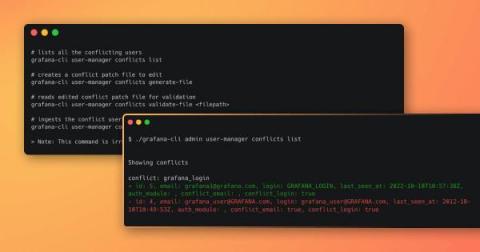
Guide to using the new Grafana CLI user identity conflict tool in Grafana 9.3
Here at Grafana Labs, one of the things we’re always working on is making Grafana more consistent. Given the increased adoption of Grafana around the world and the number of users and authentication providers we support, we wanted to create better defaults for login and email fields.
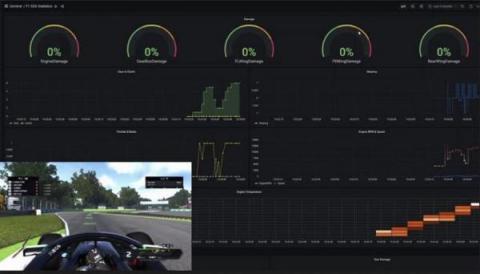
How to build a Formula 1 real-time analytics stack with Azure Data Explorer and Grafana Cloud
For Formula 1, speed is about more than just how fast you go around the track. It’s also about having data at your fingertips in real time to make critical improvements before, during, and after the race. “Formula 1 is one of the most fascinating data-driven sports,” said Anshul Sharma, Senior Product Manager at Microsoft. “It’s so competitive that even one tenth-second advantage can change the outcome of the race.”
Grafana 9.3 feature: Grafana OAuth token improvements
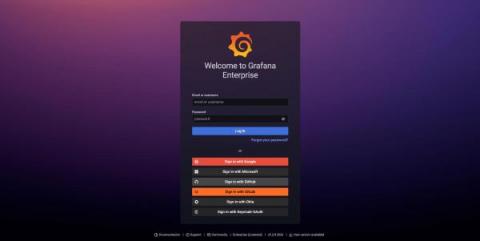
As part of our efforts to improve the security of Grafana, we introduced a long-awaited feature in the latest Grafana 9.3 release that enhances Grafana’s OAuth 2.0 compatibility. The new Grafana OAuth token improvements, which are available in Grafana OSS, Grafana Cloud, and Grafana Enterprise, ensure that the user is not only logged into Grafana, but they’re also authorized by the OAuth identity provider.
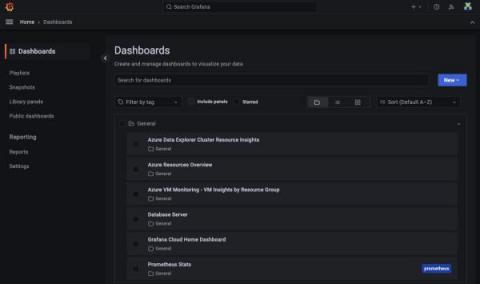
Grafana 9.3 feature: New navigation updates
As Grafana has grown from a visualization platform to an observability solution, we’ve added many tools along the way. These tools are dedicated to help you throughout the software development life cycle, whether you are trying to prevent incidents, you are monitoring your application or infrastructure, or if you are in the middle of an incident.
SCOM MI reporting - New SquaredUp Plugin
As you may have heard, Microsoft has just released the highly anticipated SCOM Managed Instance (SCOM MI) – cloud-hosted SCOM. In conjunction with this, we have launched a plugin for SquaredUp that lets you connect straight into SCOM MI and pull all the monitoring data you need!
A complete guide to managing Grafana as code: tools, tips, and tricks
We all know about the great things Grafana dashboards can do, and configuring them as code makes it possible to get even more out of them. These days, Grafana resources can mostly be managed as code in a declarative manner, which enables code review, code reuse, and in general, better workflows. This guide presents a few as code tools you can use to declaratively manage Grafana resources, plus some tips and tricks on how to incorporate them efficiently into your own use cases.
Six things you didn't know you could do with CircleCI Insights
There are hundreds of capabilities on CircleCI that were designed to create the best possible CI/CD experience for our users. But one feature that users often point to as the most valuable on the platform is the CircleCI Insights dashboard. The Insights dashboard provides full visibility into metrics like job status, duration monitoring, and solutions for pipeline optimization.
How flame graphs visualize continuous profiling data in Grafana Phlare
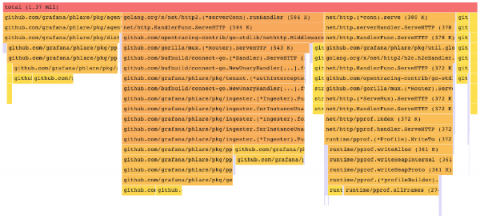
We recently announced a new open source project called Grafana Phlare. This highly available continuous profiling data source is built into Grafana core, allowing you to seamlessly monitor your profiling data. With continuous profiling, you can see which parts of your applications are consuming the most resources. You can then use that data to make any necessary tweaks to reduce consumption, which translates to lower costs.

