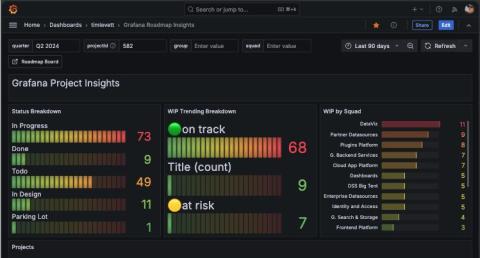
Dashboards

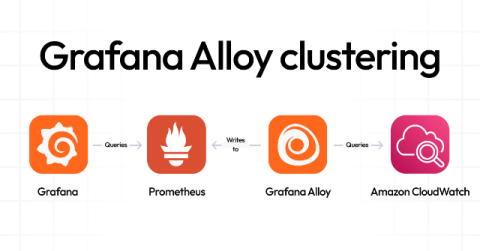
How we use Grafana Alloy clustering to scrape nearly 20M Prometheus metrics

If you are interested in running your own Grafana Alloy cluster for high availability or horizontal scalability, then you’re in the right place. That’s because we’ve already done it with our own agentless exporters system, which allows you to scrape data from providers such as Amazon CloudWatch, without running any applications on your own infrastructure.

5 useful transformations you should know to get the most out of Grafana

I’ve been a user of Grafana OSS for seven years, starting with Grafana 5.0. My, how things have evolved since then. The first time I used Grafana was to monitor a Kafka data pipeline with a bunch of Java Spring Boot microservices and Prometheus to extract metrics. I was amazed how much you could do with Grafana and Prometheus together, and so I always kept Grafana on my short list of places I wanted to put my energy, either as a contributor or by working directly for the company.

Build Dashboards for Monitoring the Remote Workforce

Remote workforce management is driving the business landscape, requiring cloud-based tools for monitoring to maintain productivity and user satisfaction. Real-User Monitoring (RUM) and synthetic transaction monitoring are powerful tools that enable organizations to diagnose and fix network issues faster for their employees wherever they work.

The Leading Analytics Dashboard Examples

You're mostly likely already tracking numerous business critical metrics but you may not be aware of how to make this process quicker and simpler. Analytics dashboards are graphical user interfaces (GUIs) that offer visual representations of data collected from multiple sources, such as databases, websites, applications, or other data repositories. These dashboards can make it much easier to derive insights from your analysis compared to examining numbers and metrics.

Grafana Tempo 2.5 release: vParquet4, streaming endpoints, and more metrics

Grafana Tempo 2.5 is here with performance improvements, vParquet4 laying the groundwork for new TraceQL features, and additional metrics capabilities! Watch the video above for a highlight of TraceQL metrics, or continue reading to get a quick overview of the latest updates in Tempo. If you’re looking for something more in-depth, don’t hesitate to jump into the Grafana Tempo 2.5 release notes or the changelog.

Introducing our Terraform provider: Dashboards as Code

Ever wished you could automatically generate a detailed and targeted dashboard at the end of your CI/CD pipeline for immediate visibility into your new deployments? Well, that’s exactly what we’re doing at SquaredUp, and we're excited to share our approach to integrating Dashboards as Code.

How to export any Grafana visualization to a CSV file, Microsoft Excel, or Google Sheets

Grafana dashboards are a great way to combine a lot of technical information into one convenient picture. From time to time, it’s also useful to export data from a particular Grafana visualization to another format, so you can further analyze it and share it with others. In this blog post, we’ll walk through how to export CSV data for any Grafana visualization you use. This makes it easy to get that data into popular spreadsheet applications, such as Microsoft Excel or Google Sheets. =

Grafana Loki query acceleration: How we sped up queries without adding resources

As we discussed when we rolled out the latest major release of Grafana Loki, we’ve grown the log aggregation system over the past five years by balancing feature development with supporting users at scale. A big part of the latter has been making queries much faster — and that was a major focus with Loki 3.0 too. We’ve seen peak query throughput grow from 10 GB/s in our Loki 1.0 days to greater than 1 TB/s even before 3.0.