Grafana 7.0 preview: New image renderer plugin to replace PhantomJS
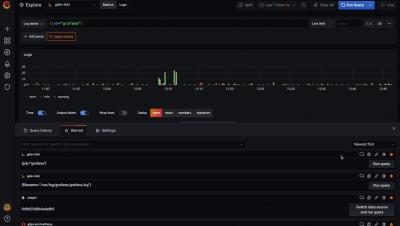
Many Grafana users export images of their dashboard panels. This feature powers the ability to receive alerts with a rendered image of the panel attached, which is valuable for quickly spotting if something is about to go sideways in production. Since Grafana v2.0, when support for server-side rendering of dashboard panels as images was introduced, PhantomJS has served as the built-in image renderer that enables this feature.